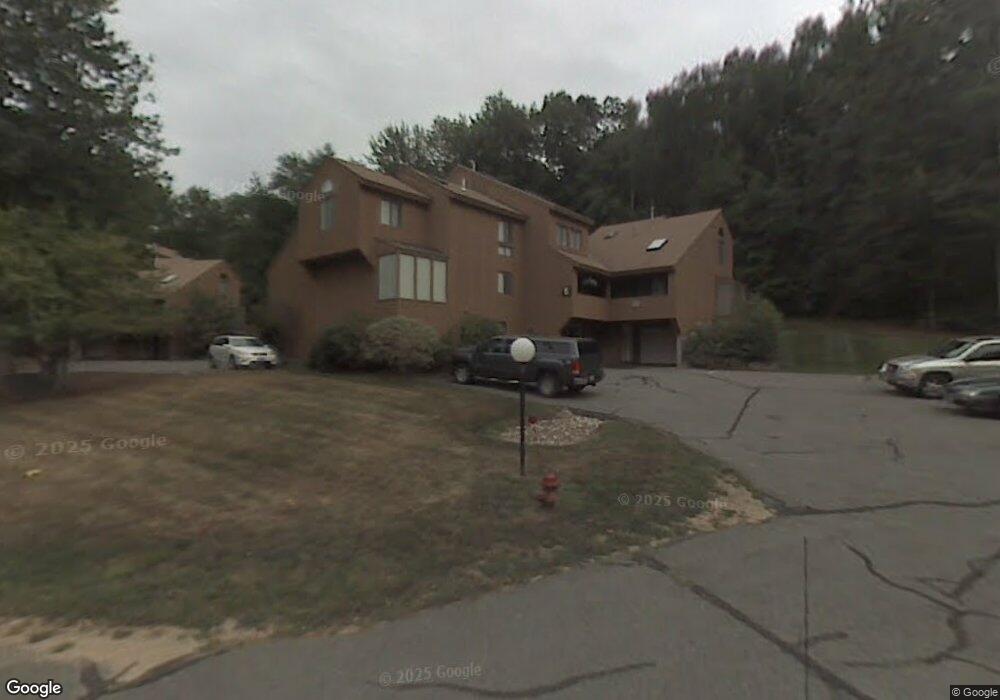
46 Eaton Ct Haverhill, MA 01832
West Parish NeighborhoodEstimated Value: $433,688 - $544,000
2
Beds
2
Baths
1,500
Sq Ft
$322/Sq Ft
Est. Value
About This Home
This home is located at 46 Eaton Ct, Haverhill, MA 01832 and is currently estimated at $482,922, approximately $321 per square foot. 46 Eaton Ct is a home located in Essex County with nearby schools including Tilton Elementary School, Silver Hill Elementary School, and Hilltop School.
Ownership History
Date
Name
Owned For
Owner Type
Purchase Details
Closed on
Sep 25, 2024
Sold by
Robb Dierdre and Robb Scott
Bought by
Robb Ft and Robb
Current Estimated Value
Purchase Details
Closed on
Nov 23, 2015
Sold by
Mignault Mary J Est and Mignault
Bought by
Robb Scott and Robb Dierdre
Purchase Details
Closed on
Apr 24, 2008
Sold by
Decrescenzo Michael J and Opresnick Nancy G
Bought by
Mignault Mary
Home Financials for this Owner
Home Financials are based on the most recent Mortgage that was taken out on this home.
Original Mortgage
$189,200
Interest Rate
6.22%
Mortgage Type
Purchase Money Mortgage
Purchase Details
Closed on
Dec 27, 1989
Sold by
Lewis Bldrs Inc
Bought by
Burzynski Gregory
Create a Home Valuation Report for This Property
The Home Valuation Report is an in-depth analysis detailing your home's value as well as a comparison with similar homes in the area
Home Values in the Area
Average Home Value in this Area
Purchase History
| Date | Buyer | Sale Price | Title Company |
|---|---|---|---|
| Robb Ft | -- | None Available | |
| Robb Ft | -- | None Available | |
| Robb Scott | $239,900 | -- | |
| Robb Scott | $239,900 | -- | |
| Mignault Mary | $236,500 | -- | |
| Mignault Mary | $236,500 | -- | |
| Burzynski Gregory | $125,000 | -- | |
| Burzynski Gregory | $125,000 | -- |
Source: Public Records
Mortgage History
| Date | Status | Borrower | Loan Amount |
|---|---|---|---|
| Previous Owner | Burzynski Gregory | $186,500 | |
| Previous Owner | Burzynski Gregory | $189,200 |
Source: Public Records
Tax History Compared to Growth
Tax History
| Year | Tax Paid | Tax Assessment Tax Assessment Total Assessment is a certain percentage of the fair market value that is determined by local assessors to be the total taxable value of land and additions on the property. | Land | Improvement |
|---|---|---|---|---|
| 2025 | $4,056 | $378,700 | $0 | $378,700 |
| 2024 | $3,866 | $363,300 | $0 | $363,300 |
| 2023 | $3,736 | $335,100 | $0 | $335,100 |
| 2022 | $3,674 | $288,800 | $0 | $288,800 |
| 2021 | $3,470 | $258,200 | $0 | $258,200 |
| 2020 | $3,393 | $249,500 | $0 | $249,500 |
| 2019 | $3,083 | $221,000 | $0 | $221,000 |
| 2018 | $3,033 | $212,700 | $0 | $212,700 |
| 2017 | $3,056 | $203,900 | $0 | $203,900 |
| 2016 | $2,992 | $194,800 | $0 | $194,800 |
| 2015 | $2,849 | $185,600 | $0 | $185,600 |
Source: Public Records
Map
Nearby Homes
- 216 Morgan Dr Unit 216
- 43 Mercury Terrace
- 21 Mercury Terrace
- 12 Perkins Ct Unit 12
- 81 Clement Ct
- 1 W Parish Ct
- 16 W Parish Ct
- 186 Mohawk Trail
- 13 Sylvan Hill Crossing
- 23 Sylvan Hill Crossing
- 43 W Parish Ct Unit 30-A
- 655 W Lowell Ave Unit 6
- 39 Clement Ct Unit 58A
- 132 W Meadow Rd Unit 18
- 635 W Lowell Ave Unit 7
- 3 Lucy Way
- 2 Danforth Ct
- 51 Kelly St
- 33 Lake St
- 29 Prescott St
- 52 Eaton Ct
- 50 Eaton Ct
- 48 Eaton Ct
- 50 Eaton Ct Unit 50,5
- 50 Eaton Ct Unit 50
- 50 Eaton Ct Unit 5B
- 46 Eaton Ct Unit 46
- 48 Eaton Ct Unit 48
- 44 Eaton Ct
- 42 Eaton Ct
- 40 Eaton Ct
- 38 Eaton Ct
- 44 Eaton Ct Unit Bld 4,U:44
- 27 Eaton Ct
- 25 Eaton Ct
- 23 Eaton Ct
- 21 Eaton Ct
- 19 Eaton Ct
- 21 Eaton Ct Unit 21
- 27 Eaton Ct Unit 27,6