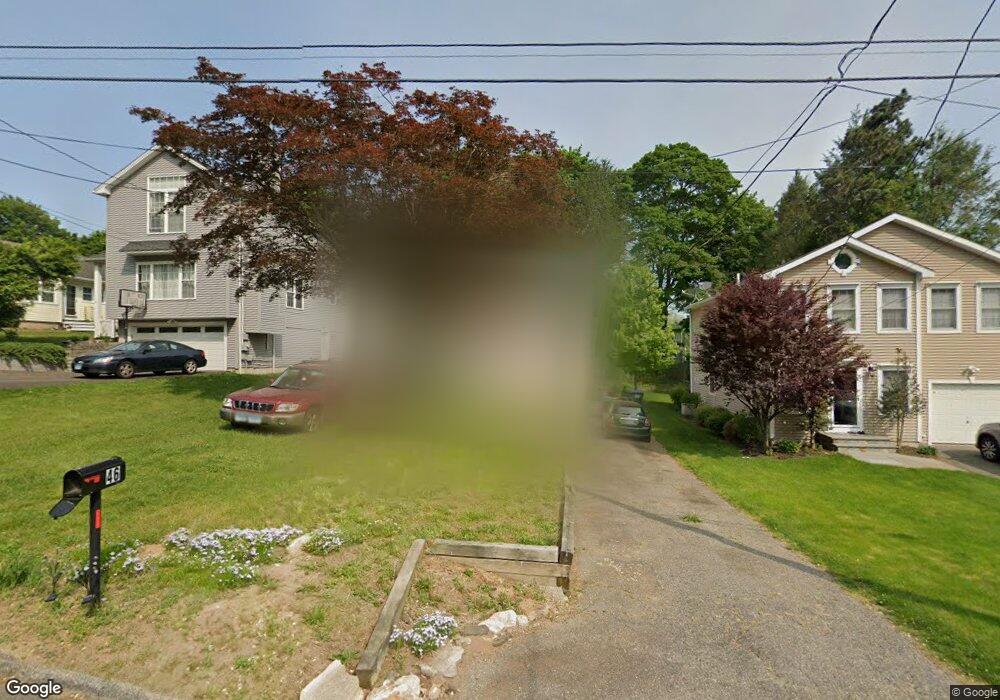
46 Elberta Ave Trumbull, CT 06611
Trumbull Center NeighborhoodEstimated Value: $347,000 - $454,000
3
Beds
2
Baths
1,072
Sq Ft
$388/Sq Ft
Est. Value
About This Home
This home is located at 46 Elberta Ave, Trumbull, CT 06611 and is currently estimated at $416,079, approximately $388 per square foot. 46 Elberta Ave is a home located in Fairfield County with nearby schools including Booth Hill School, Hillcrest Middle School, and Trumbull High School.
Ownership History
Date
Name
Owned For
Owner Type
Purchase Details
Closed on
Jun 24, 2009
Sold by
Fhlmc
Bought by
Dilorenzo Alciia H
Current Estimated Value
Home Financials for this Owner
Home Financials are based on the most recent Mortgage that was taken out on this home.
Original Mortgage
$147,120
Outstanding Balance
$93,304
Interest Rate
4.92%
Estimated Equity
$322,775
Purchase Details
Closed on
Jun 5, 2009
Sold by
Miranda Jose Alberto
Bought by
Indymac Bank Fsb
Home Financials for this Owner
Home Financials are based on the most recent Mortgage that was taken out on this home.
Original Mortgage
$147,120
Outstanding Balance
$93,304
Interest Rate
4.92%
Estimated Equity
$322,775
Purchase Details
Closed on
Mar 20, 2009
Sold by
Miranda Jose Acberto
Bought by
Indymac Bank Fsb
Purchase Details
Closed on
Sep 23, 2004
Sold by
Mavro Charles D and Mauro Kimberly R
Bought by
Mironda Jose Alberto
Purchase Details
Closed on
Nov 1, 1996
Sold by
Cavuoto Frederick
Bought by
Mauro Charles D and Mauro Kimberly R
Create a Home Valuation Report for This Property
The Home Valuation Report is an in-depth analysis detailing your home's value as well as a comparison with similar homes in the area
Home Values in the Area
Average Home Value in this Area
Purchase History
| Date | Buyer | Sale Price | Title Company |
|---|---|---|---|
| Dilorenzo Alciia H | $180,900 | -- | |
| Indymac Bank Fsb | -- | -- | |
| Indymac Bank Fsb | -- | -- | |
| Mironda Jose Alberto | $292,000 | -- | |
| Mauro Charles D | $115,000 | -- |
Source: Public Records
Mortgage History
| Date | Status | Borrower | Loan Amount |
|---|---|---|---|
| Open | Mauro Charles D | $34,750 | |
| Open | Mauro Charles D | $147,120 |
Source: Public Records
Tax History
| Year | Tax Paid | Tax Assessment Tax Assessment Total Assessment is a certain percentage of the fair market value that is determined by local assessors to be the total taxable value of land and additions on the property. | Land | Improvement |
|---|---|---|---|---|
| 2025 | $6,993 | $189,420 | $113,120 | $76,300 |
| 2024 | $6,802 | $189,420 | $113,120 | $76,300 |
| 2023 | $6,692 | $189,420 | $113,120 | $76,300 |
| 2022 | $6,585 | $189,420 | $113,120 | $76,300 |
| 2021 | $6,037 | $165,200 | $97,650 | $67,550 |
| 2020 | $5,922 | $165,200 | $97,650 | $67,550 |
| 2018 | $5,776 | $165,200 | $97,650 | $67,550 |
| 2017 | $5,660 | $165,200 | $97,650 | $67,550 |
| 2016 | $5,546 | $165,200 | $97,650 | $67,550 |
| 2015 | $5,159 | $151,900 | $84,300 | $67,600 |
| 2014 | $5,048 | $151,900 | $84,300 | $67,600 |
Source: Public Records
Map
Nearby Homes
- 877 White Plains Rd
- 58 Daniels Farm Rd
- 546 Church Hill Rd
- 30 Windy Ridge
- 21 Rexview Cir
- 1403 Old Town Rd Unit 1403
- 9 Sunnyridge Pkwy
- Lot 31 Valley View Rd
- 74 Village Ln
- 68 Old Dike Rd
- 45 Frenchtown Rd
- 46 Oakleaf St
- 60 Quail Trail
- 94 Grove St
- 7 E Lake Rd
- 65 Bonnie View Dr
- 563 Lakeside Dr
- 0 Lot #4 & Lot #5 W Mischa Rd Unit 24138429
- 11 Linda Dr
- 26 Grove St
- 48 Elberta Ave
- 44 Elberta Ave
- 42 Elberta Ave
- 50 Elberta Ave
- 35 Hillside Ave
- 33 Hillside Ave
- 37 Hillside Ave
- 40 Elberta Ave
- 31 Hillside Ave
- 47 Elberta Ave
- 27 Hillside Ave
- 41 Elberta Ave
- 51 Elberta Ave
- 9 Berkshire Ave
- 38 Elberta Ave
- 53 Elberta Ave
- 39 Elberta Ave
- 5 Berkshire Ave
- 34 Elberta Ave
- 31 Sunset Ave
Your Personal Tour Guide
Ask me questions while you tour the home.