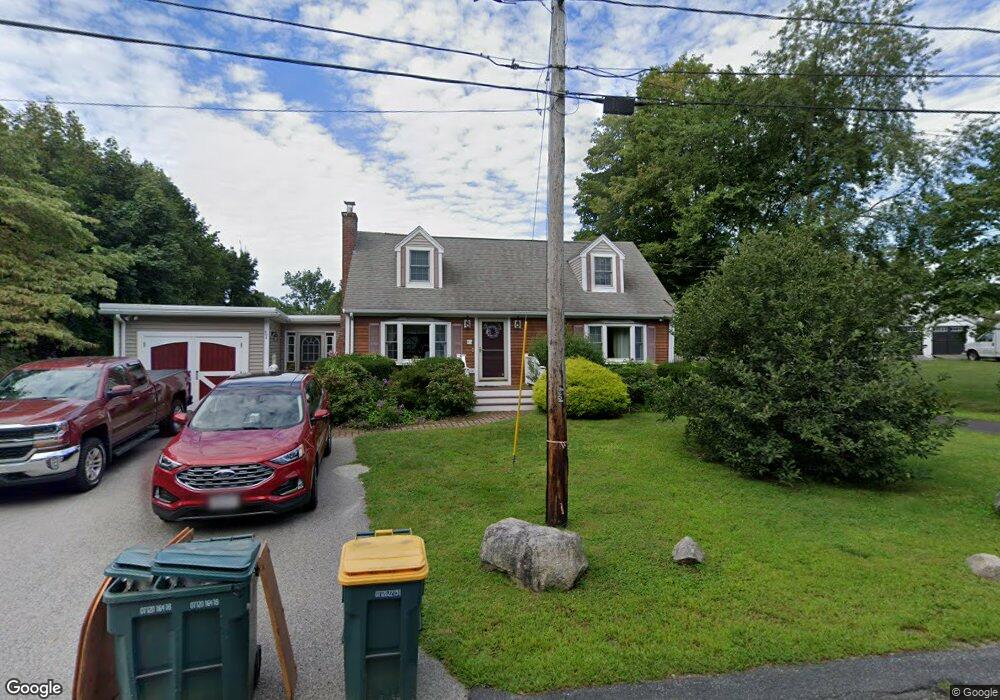
46 Elm St Abington, MA 02351
Estimated Value: $552,000 - $646,000
4
Beds
3
Baths
1,512
Sq Ft
$397/Sq Ft
Est. Value
About This Home
This home is located at 46 Elm St, Abington, MA 02351 and is currently estimated at $600,261, approximately $396 per square foot. 46 Elm St is a home located in Plymouth County with nearby schools including Beaver Brook Elementary School, Abington Middle School, and Woodsdale School.
Ownership History
Date
Name
Owned For
Owner Type
Purchase Details
Closed on
Jul 13, 2024
Sold by
Crane Joseph S and Crane Robyn L
Bought by
Crane Ft and Crane
Current Estimated Value
Purchase Details
Closed on
Oct 26, 1992
Sold by
Pihl Elsie J Est Of
Bought by
Crane Joseph S and Crane Robyn L
Create a Home Valuation Report for This Property
The Home Valuation Report is an in-depth analysis detailing your home's value as well as a comparison with similar homes in the area
Home Values in the Area
Average Home Value in this Area
Purchase History
| Date | Buyer | Sale Price | Title Company |
|---|---|---|---|
| Crane Ft | -- | None Available | |
| Crane Ft | -- | None Available | |
| Crane Joseph S | $125,000 | -- |
Source: Public Records
Mortgage History
| Date | Status | Borrower | Loan Amount |
|---|---|---|---|
| Previous Owner | Crane Joseph S | $284,800 | |
| Previous Owner | Crane Joseph S | $40,000 | |
| Previous Owner | Crane Joseph S | $20,000 |
Source: Public Records
Tax History Compared to Growth
Tax History
| Year | Tax Paid | Tax Assessment Tax Assessment Total Assessment is a certain percentage of the fair market value that is determined by local assessors to be the total taxable value of land and additions on the property. | Land | Improvement |
|---|---|---|---|---|
| 2025 | $6,518 | $499,100 | $243,800 | $255,300 |
| 2024 | $6,785 | $507,100 | $222,100 | $285,000 |
| 2023 | $6,456 | $454,300 | $193,700 | $260,600 |
| 2022 | $6,592 | $433,100 | $170,100 | $263,000 |
| 2021 | $6,000 | $364,100 | $154,700 | $209,400 |
| 2020 | $6,101 | $358,900 | $150,100 | $208,800 |
| 2019 | $5,772 | $331,900 | $143,200 | $188,700 |
| 2018 | $5,982 | $323,900 | $143,200 | $180,700 |
| 2017 | $5,107 | $278,300 | $143,200 | $135,100 |
| 2016 | $4,734 | $264,000 | $136,600 | $127,400 |
| 2015 | $4,383 | $257,800 | $136,600 | $121,200 |
Source: Public Records
Map
Nearby Homes
- 40 Bedford St
- 37 Rockland St
- 10 Bank St
- 87 Summer St
- 257 Rockland St Unit 257
- 89 Andrew Ford Way
- 133 Andrew Ford Way
- 333 Groveland St
- 34 George h Gillespie Way
- 116 Hancock St
- 1098 Bedford St
- 164 Hancock St
- 209 Hancock St
- 193 Linwood St
- 360 High St
- 676 Bedford St
- 14 Doris Dr
- 63 Rice St
- 332 Hancock St
- 300 High St