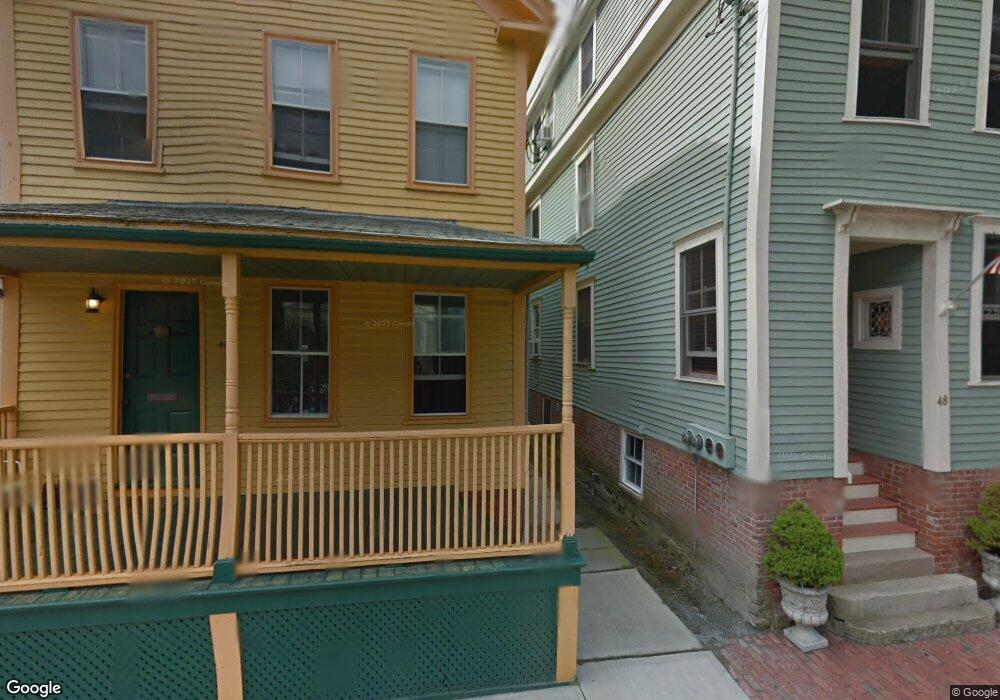
46 Elm St Newport, RI 02840
Estimated Value: $1,071,000 - $1,702,000
4
Beds
3
Baths
1,900
Sq Ft
$695/Sq Ft
Est. Value
About This Home
This home is located at 46 Elm St, Newport, RI 02840 and is currently estimated at $1,320,005, approximately $694 per square foot. 46 Elm St is a home located in Newport County with nearby schools including Rogers High School, St Michael's Country Day School, and St George's School.
Ownership History
Date
Name
Owned For
Owner Type
Purchase Details
Closed on
Mar 23, 2015
Sold by
Paisner David and Withington Wendy R
Bought by
Babcock Christopher M and Babcock Jill M
Current Estimated Value
Purchase Details
Closed on
Feb 27, 2012
Sold by
Est Roger W Prouty and Ikauniks Eric
Bought by
Paisner David and Withington Wendy R
Home Financials for this Owner
Home Financials are based on the most recent Mortgage that was taken out on this home.
Original Mortgage
$200,000
Interest Rate
3.89%
Mortgage Type
Adjustable Rate Mortgage/ARM
Purchase Details
Closed on
Oct 21, 1994
Sold by
Oconnor Kevin M
Bought by
Prouty Roger W
Purchase Details
Closed on
Jul 14, 1989
Sold by
Bonner James
Bought by
Oconnor Kevin
Home Financials for this Owner
Home Financials are based on the most recent Mortgage that was taken out on this home.
Original Mortgage
$153,000
Interest Rate
10.39%
Create a Home Valuation Report for This Property
The Home Valuation Report is an in-depth analysis detailing your home's value as well as a comparison with similar homes in the area
Home Values in the Area
Average Home Value in this Area
Purchase History
| Date | Buyer | Sale Price | Title Company |
|---|---|---|---|
| Babcock Christopher M | $450,000 | -- | |
| Paisner David | $85,000 | -- | |
| Paisner David | $85,000 | -- | |
| Prouty Roger W | $170,000 | -- | |
| Oconnor Kevin | $170,000 | -- |
Source: Public Records
Mortgage History
| Date | Status | Borrower | Loan Amount |
|---|---|---|---|
| Previous Owner | Paisner David | $200,000 | |
| Previous Owner | Oconnor Kevin | $127,200 | |
| Previous Owner | Oconnor Kevin | $153,000 |
Source: Public Records
Tax History Compared to Growth
Tax History
| Year | Tax Paid | Tax Assessment Tax Assessment Total Assessment is a certain percentage of the fair market value that is determined by local assessors to be the total taxable value of land and additions on the property. | Land | Improvement |
|---|---|---|---|---|
| 2025 | $9,160 | $1,054,200 | $475,100 | $579,100 |
| 2024 | $8,666 | $1,054,200 | $475,100 | $579,100 |
| 2023 | $6,824 | $687,900 | $312,700 | $375,200 |
| 2022 | $6,611 | $687,900 | $312,700 | $375,200 |
| 2021 | $6,418 | $687,900 | $312,700 | $375,200 |
| 2020 | $5,926 | $576,500 | $306,900 | $269,600 |
| 2019 | $5,926 | $576,500 | $306,900 | $269,600 |
| 2018 | $5,759 | $576,500 | $306,900 | $269,600 |
| 2017 | $5,408 | $482,400 | $235,900 | $246,500 |
| 2016 | $4,664 | $426,700 | $235,900 | $190,800 |
| 2015 | $4,415 | $413,800 | $235,900 | $177,900 |
| 2014 | $4,228 | $350,600 | $184,500 | $166,100 |
Source: Public Records
Map
Nearby Homes
- 35 Second St
- 43 Poplar St
- 0 Second St
- 23 Willow St
- 11 Willow St Unit 5
- 12 Poplar St
- 7 Cozzens Ct
- 74 Third St
- 31 Coddington St Unit 24
- 17 Warner St
- 104 Second St
- 27 Soar Way
- 69 Spring St
- 102 Broadway Unit 2B
- 87 Spring St
- 5 Bowser Ct
- 10 Barney St Unit 102
- 10 Barney St Unit 107
- 10 Barney St Unit 101
- 10 Barney St Unit U106