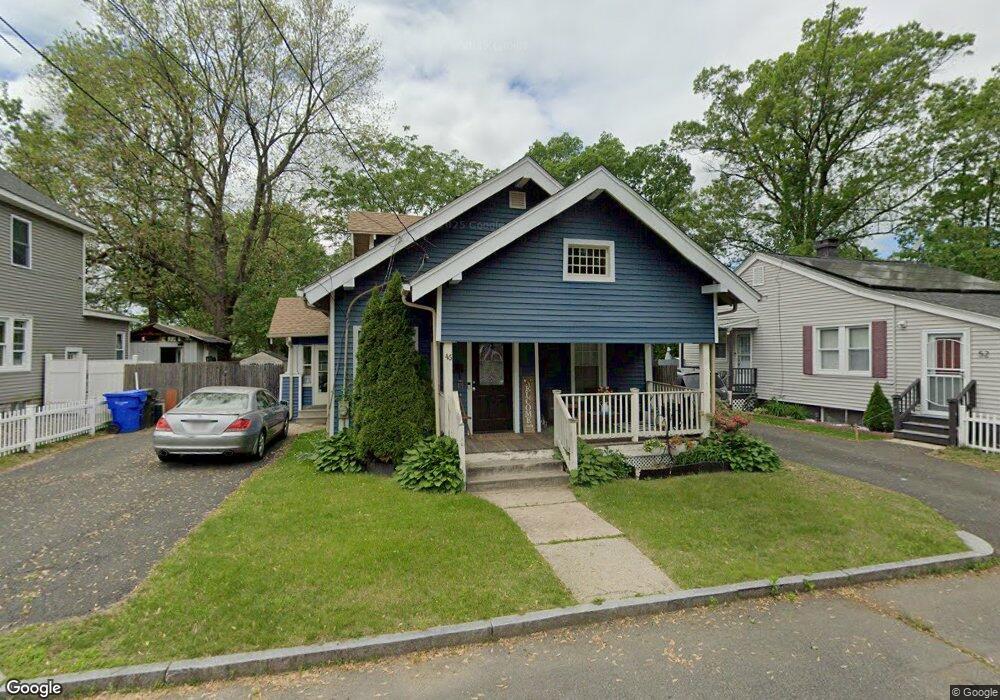
46 Emily St Springfield, MA 01109
Pine Point NeighborhoodEstimated Value: $218,000 - $256,000
4
Beds
1
Bath
1,130
Sq Ft
$213/Sq Ft
Est. Value
About This Home
This home is located at 46 Emily St, Springfield, MA 01109 and is currently estimated at $240,451, approximately $212 per square foot. 46 Emily St is a home located in Hampden County with nearby schools including Hiram L. Dorman Elementary, John F. Kennedy Academy, and Springfield Central High School.
Ownership History
Date
Name
Owned For
Owner Type
Purchase Details
Closed on
Nov 6, 2009
Sold by
Awkal Imadeddine
Bought by
Neveins Siddeeqah S
Current Estimated Value
Home Financials for this Owner
Home Financials are based on the most recent Mortgage that was taken out on this home.
Original Mortgage
$84,000
Outstanding Balance
$55,017
Interest Rate
5.06%
Mortgage Type
Purchase Money Mortgage
Estimated Equity
$185,434
Purchase Details
Closed on
Jul 2, 2009
Sold by
Bobish Jeanne Ann
Bought by
Awkai Imadeddine
Purchase Details
Closed on
Jul 9, 2008
Sold by
Indessi Julie Ann
Bought by
Bobish Jeanne Ann
Create a Home Valuation Report for This Property
The Home Valuation Report is an in-depth analysis detailing your home's value as well as a comparison with similar homes in the area
Home Values in the Area
Average Home Value in this Area
Purchase History
| Date | Buyer | Sale Price | Title Company |
|---|---|---|---|
| Neveins Siddeeqah S | $105,000 | -- | |
| Awkai Imadeddine | $40,000 | -- | |
| Bobish Jeanne Ann | -- | -- | |
| Bobish Jeanne Ann | -- | -- |
Source: Public Records
Mortgage History
| Date | Status | Borrower | Loan Amount |
|---|---|---|---|
| Open | Neveins Siddeeqah S | $84,000 |
Source: Public Records
Tax History
| Year | Tax Paid | Tax Assessment Tax Assessment Total Assessment is a certain percentage of the fair market value that is determined by local assessors to be the total taxable value of land and additions on the property. | Land | Improvement |
|---|---|---|---|---|
| 2025 | $2,181 | $139,100 | $36,200 | $102,900 |
| 2024 | $2,240 | $139,500 | $36,200 | $103,300 |
| 2023 | $2,024 | $118,700 | $32,000 | $86,700 |
| 2022 | $2,209 | $117,400 | $29,900 | $87,500 |
| 2021 | $2,020 | $106,900 | $27,200 | $79,700 |
| 2020 | $1,853 | $94,900 | $27,200 | $67,700 |
| 2019 | $1,698 | $86,300 | $28,200 | $58,100 |
| 2018 | $1,708 | $86,800 | $28,200 | $58,600 |
| 2017 | $1,549 | $78,800 | $31,000 | $47,800 |
| 2016 | $1,557 | $79,200 | $31,000 | $48,200 |
| 2015 | $1,583 | $80,500 | $31,000 | $49,500 |
Source: Public Records
Map
Nearby Homes
Your Personal Tour Guide
Ask me questions while you tour the home.