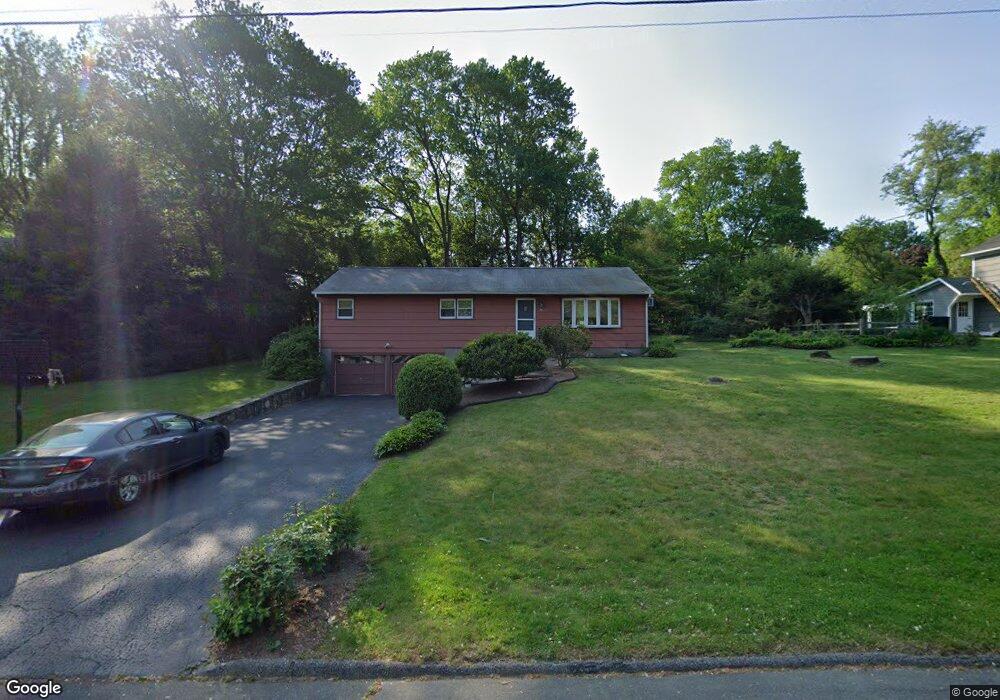
46 Gibson Ave Trumbull, CT 06611
Trumbull Center NeighborhoodEstimated Value: $578,000 - $753,000
3
Beds
3
Baths
1,936
Sq Ft
$334/Sq Ft
Est. Value
About This Home
This home is located at 46 Gibson Ave, Trumbull, CT 06611 and is currently estimated at $647,333, approximately $334 per square foot. 46 Gibson Ave is a home located in Fairfield County with nearby schools including Middlebrook School, Madison Middle School, and Trumbull High School.
Ownership History
Date
Name
Owned For
Owner Type
Purchase Details
Closed on
Sep 9, 2019
Sold by
Satter Blair
Bought by
Satter Ellen
Current Estimated Value
Purchase Details
Closed on
Jun 30, 1995
Sold by
Wheeler Rosalie
Bought by
Satter Blair and Satter Ellen
Home Financials for this Owner
Home Financials are based on the most recent Mortgage that was taken out on this home.
Original Mortgage
$156,600
Interest Rate
7.8%
Mortgage Type
Unknown
Create a Home Valuation Report for This Property
The Home Valuation Report is an in-depth analysis detailing your home's value as well as a comparison with similar homes in the area
Home Values in the Area
Average Home Value in this Area
Purchase History
| Date | Buyer | Sale Price | Title Company |
|---|---|---|---|
| Satter Ellen | -- | -- | |
| Satter Blair | $174,000 | -- |
Source: Public Records
Mortgage History
| Date | Status | Borrower | Loan Amount |
|---|---|---|---|
| Previous Owner | Satter Blair | $185,000 | |
| Previous Owner | Satter Blair | $256,000 | |
| Previous Owner | Satter Blair | $150,000 | |
| Previous Owner | Satter Blair | $156,600 |
Source: Public Records
Tax History
| Year | Tax Paid | Tax Assessment Tax Assessment Total Assessment is a certain percentage of the fair market value that is determined by local assessors to be the total taxable value of land and additions on the property. | Land | Improvement |
|---|---|---|---|---|
| 2025 | $9,707 | $262,920 | $155,960 | $106,960 |
| 2024 | $9,441 | $262,920 | $155,960 | $106,960 |
| 2023 | $9,289 | $262,920 | $155,960 | $106,960 |
| 2022 | $9,140 | $262,920 | $155,960 | $106,960 |
| 2021 | $7,999 | $218,890 | $129,990 | $88,900 |
| 2020 | $7,847 | $218,890 | $129,990 | $88,900 |
| 2018 | $7,653 | $218,890 | $129,990 | $88,900 |
| 2017 | $7,499 | $218,890 | $129,990 | $88,900 |
| 2016 | $7,348 | $218,890 | $129,990 | $88,900 |
| 2015 | $7,475 | $220,100 | $130,000 | $90,100 |
| 2014 | $7,314 | $220,100 | $130,000 | $90,100 |
Source: Public Records
Map
Nearby Homes
- 30 Windy Ridge
- 75 Middlebrooks Ave
- 26 Grove St
- Lot 31 Valley View Rd
- 546 Church Hill Rd
- 58 Daniels Farm Rd
- 877 White Plains Rd
- 215 Fernwood Rd
- 40 Rose Terrace
- 45 Frenchtown Rd
- 65 Bonnie View Dr
- 71 Cider Mill Ln
- 11 Linda Dr
- 74 Village Ln
- 114 Minturn Place
- 563 Lakeside Dr
- 110 Minturn Rd
- 15 Glenarden Rd
- lot 194 Prospect Ave
- 21 Histon Rd
Your Personal Tour Guide
Ask me questions while you tour the home.