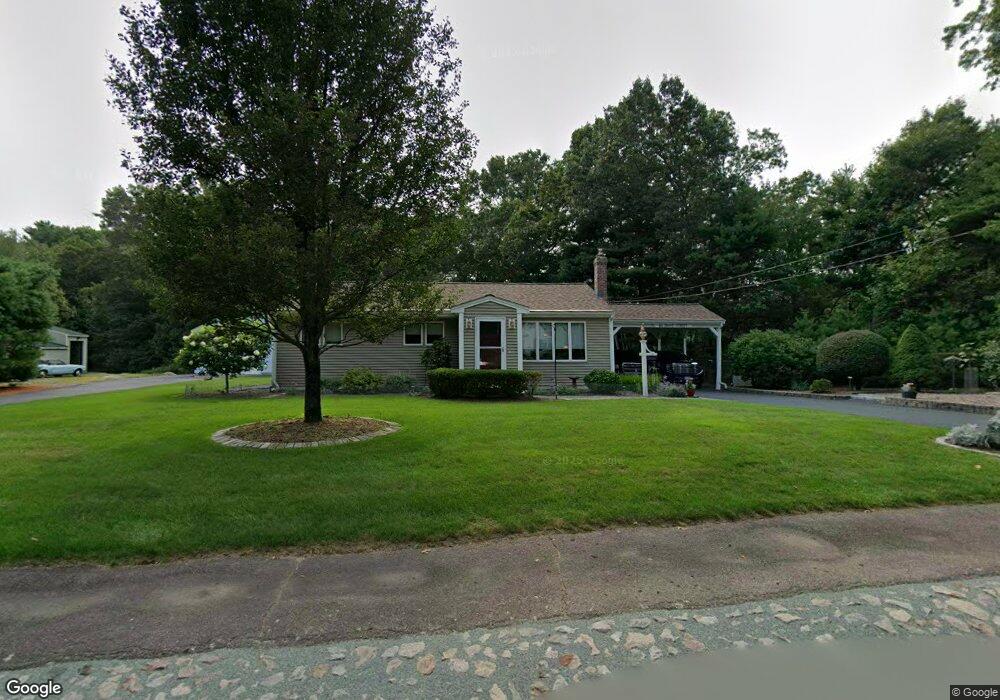
46 Grove St Mansfield, MA 02048
Estimated Value: $514,000 - $633,000
3
Beds
1
Bath
1,138
Sq Ft
$492/Sq Ft
Est. Value
About This Home
This home is located at 46 Grove St, Mansfield, MA 02048 and is currently estimated at $559,344, approximately $491 per square foot. 46 Grove St is a home located in Bristol County with nearby schools including Everett W. Robinson Elementary School, Jordan/Jackson Elementary School, and Harold L. Qualters Middle School.
Ownership History
Date
Name
Owned For
Owner Type
Purchase Details
Closed on
Jun 30, 2006
Sold by
Driscoll Donna L and Urquhart Donna L
Bought by
Driscoll Donna L and Driscoll William A
Current Estimated Value
Home Financials for this Owner
Home Financials are based on the most recent Mortgage that was taken out on this home.
Original Mortgage
$104,000
Interest Rate
6.58%
Mortgage Type
Purchase Money Mortgage
Purchase Details
Closed on
Oct 16, 1990
Sold by
Suess Douglas P
Bought by
Driscoll William A
Create a Home Valuation Report for This Property
The Home Valuation Report is an in-depth analysis detailing your home's value as well as a comparison with similar homes in the area
Home Values in the Area
Average Home Value in this Area
Purchase History
| Date | Buyer | Sale Price | Title Company |
|---|---|---|---|
| Driscoll Donna L | -- | -- | |
| Driscoll William A | $125,000 | -- |
Source: Public Records
Mortgage History
| Date | Status | Borrower | Loan Amount |
|---|---|---|---|
| Closed | Driscoll William A | $63,000 | |
| Closed | Driscoll William A | $86,000 | |
| Closed | Driscoll Donna L | $104,000 | |
| Previous Owner | Driscoll William A | $85,500 | |
| Previous Owner | Driscoll William A | $114,600 |
Source: Public Records
Tax History Compared to Growth
Tax History
| Year | Tax Paid | Tax Assessment Tax Assessment Total Assessment is a certain percentage of the fair market value that is determined by local assessors to be the total taxable value of land and additions on the property. | Land | Improvement |
|---|---|---|---|---|
| 2025 | $6,727 | $510,800 | $244,100 | $266,700 |
| 2024 | $6,278 | $465,000 | $244,100 | $220,900 |
| 2023 | $6,188 | $439,200 | $244,100 | $195,100 |
| 2022 | $5,974 | $393,800 | $226,000 | $167,800 |
| 2021 | $5,330 | $364,900 | $197,800 | $167,100 |
| 2020 | $3,930 | $350,800 | $188,400 | $162,400 |
| 2019 | $4,978 | $327,100 | $156,900 | $170,200 |
| 2018 | $4,794 | $300,900 | $149,600 | $151,300 |
| 2017 | $4,575 | $304,600 | $145,400 | $159,200 |
| 2016 | $4,566 | $296,300 | $138,400 | $157,900 |
| 2015 | $4,219 | $272,200 | $138,400 | $133,800 |
Source: Public Records
Map
Nearby Homes