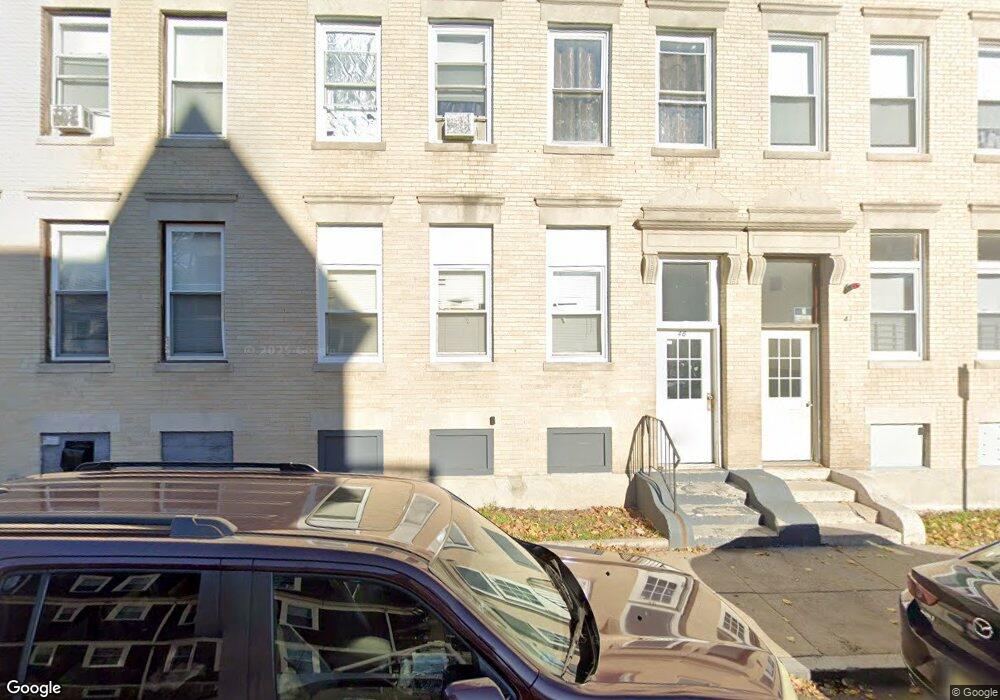
46 Harlem St Dorchester, MA 02121
Franklin Field North NeighborhoodEstimated Value: $762,000 - $942,142
9
Beds
2
Baths
4,318
Sq Ft
$190/Sq Ft
Est. Value
About This Home
This home is located at 46 Harlem St, Dorchester, MA 02121 and is currently estimated at $820,536, approximately $190 per square foot. 46 Harlem St is a home located in Suffolk County with nearby schools including Codman Academy Charter Public School and Mother Caroline Academy & Education Center.
Ownership History
Date
Name
Owned For
Owner Type
Purchase Details
Closed on
Jan 30, 2025
Sold by
Ephesus Llc
Bought by
Erica Davis Estates Llc
Current Estimated Value
Home Financials for this Owner
Home Financials are based on the most recent Mortgage that was taken out on this home.
Original Mortgage
$814,850
Outstanding Balance
$809,092
Interest Rate
6.72%
Mortgage Type
Commercial
Estimated Equity
$11,444
Purchase Details
Closed on
Dec 19, 2024
Sold by
Wheeler Denise L
Bought by
Ephesus Llc
Home Financials for this Owner
Home Financials are based on the most recent Mortgage that was taken out on this home.
Original Mortgage
$814,850
Outstanding Balance
$809,092
Interest Rate
6.72%
Mortgage Type
Commercial
Estimated Equity
$11,444
Purchase Details
Closed on
Jun 8, 2015
Sold by
Lane Charles M
Bought by
Wheeler Denise and Lane Charles M
Create a Home Valuation Report for This Property
The Home Valuation Report is an in-depth analysis detailing your home's value as well as a comparison with similar homes in the area
Home Values in the Area
Average Home Value in this Area
Purchase History
| Date | Buyer | Sale Price | Title Company |
|---|---|---|---|
| Erica Davis Estates Llc | $763,000 | None Available | |
| Erica Davis Estates Llc | $763,000 | None Available | |
| Ephesus Llc | $600,000 | None Available | |
| Ephesus Llc | $600,000 | None Available | |
| Ephesus Llc | $600,000 | None Available | |
| Wheeler Denise | -- | -- | |
| Wheeler Denise | -- | -- | |
| Wheeler Denise | -- | -- |
Source: Public Records
Mortgage History
| Date | Status | Borrower | Loan Amount |
|---|---|---|---|
| Open | Erica Davis Estates Llc | $814,850 | |
| Closed | Erica Davis Estates Llc | $814,850 |
Source: Public Records
Tax History Compared to Growth
Tax History
| Year | Tax Paid | Tax Assessment Tax Assessment Total Assessment is a certain percentage of the fair market value that is determined by local assessors to be the total taxable value of land and additions on the property. | Land | Improvement |
|---|---|---|---|---|
| 2025 | $8,750 | $755,600 | $250,900 | $504,700 |
| 2024 | $7,065 | $648,200 | $259,600 | $388,600 |
| 2023 | $6,569 | $611,600 | $245,000 | $366,600 |
| 2022 | $6,049 | $556,000 | $222,700 | $333,300 |
| 2021 | $5,650 | $529,500 | $212,100 | $317,400 |
| 2020 | $5,397 | $511,100 | $203,800 | $307,300 |
| 2019 | $4,684 | $444,400 | $167,600 | $276,800 |
| 2018 | $4,234 | $404,000 | $167,600 | $236,400 |
| 2017 | $4,278 | $404,000 | $167,600 | $236,400 |
| 2016 | $4,315 | $392,300 | $167,600 | $224,700 |
| 2015 | $3,925 | $324,100 | $118,600 | $205,500 |
| 2014 | $3,614 | $287,300 | $118,600 | $168,700 |
Source: Public Records
Map
Nearby Homes
- 64 Greenwood St
- 69 Greenwood St
- 74 Glenway St
- 40 Elmont St Unit 2
- 27 Bradshaw St
- 52 Mclellan St
- 408 Seaver St Unit 2
- 35 Bradshaw St
- 54 Bicknell St Unit 3
- 54 Bicknell St Unit 2
- 54 Bicknell St Unit 1
- 9-13 Hewins St
- 52 Bicknell St
- 21 Mclellan St
- 41 Charlotte St
- 15 Mclellan St
- 15 Ellington St
- 88 Esmond St
- 12 Spencer St
- 7-9 Esmond St
- 46 Harlem St
- 44 Harlem St
- 44 Harlem St Unit 2
- 48 Harlem St
- 50 Harlem St Unit 3
- 50 Harlem St Unit 2
- 50 Harlem St Unit 1
- 50 Harlem St
- 40 Harlem St
- 36 Harlem St Unit 38
- 89 Fowler St Unit 91
- 49 Greenwood St
- 85 Fowler St Unit 87
- 85 Fowler St Unit 1
- 89-91 Fowler St
- 81 Fowler St Unit 83
- 32 Harlem St
- 42 Greenwood St
- 42 Greenwood St Unit 3
- 42 Greenwood St Unit 2