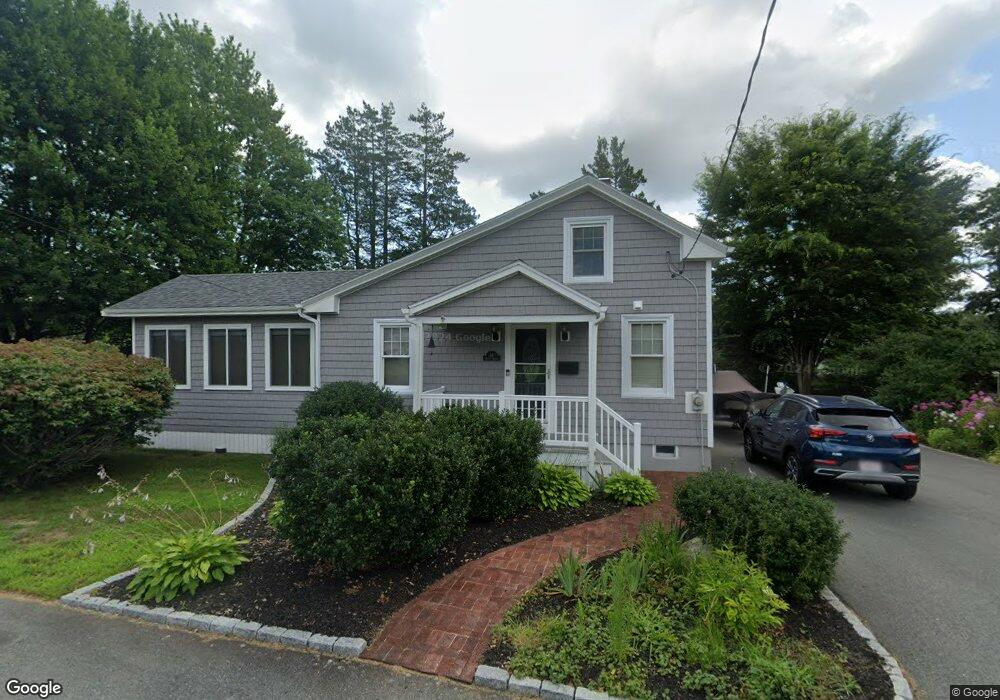
46 Hayes St Acushnet, MA 02743
Estimated Value: $400,000 - $440,000
3
Beds
1
Bath
1,357
Sq Ft
$305/Sq Ft
Est. Value
About This Home
This home is located at 46 Hayes St, Acushnet, MA 02743 and is currently estimated at $414,511, approximately $305 per square foot. 46 Hayes St is a home located in Bristol County with nearby schools including Acushnet Elementary School, Albert F Ford Middle School, and Alma Del Mar Charter School.
Ownership History
Date
Name
Owned For
Owner Type
Purchase Details
Closed on
May 9, 2024
Sold by
Dore Ronald J and Dore Donna M
Bought by
Dore Rt and Dore
Current Estimated Value
Purchase Details
Closed on
Dec 28, 1988
Sold by
Lapointe Paul J
Bought by
Desnoyers Donna
Create a Home Valuation Report for This Property
The Home Valuation Report is an in-depth analysis detailing your home's value as well as a comparison with similar homes in the area
Home Values in the Area
Average Home Value in this Area
Purchase History
| Date | Buyer | Sale Price | Title Company |
|---|---|---|---|
| Dore Rt | -- | None Available | |
| Dore Rt | -- | None Available | |
| Desnoyers Donna | $102,000 | -- |
Source: Public Records
Mortgage History
| Date | Status | Borrower | Loan Amount |
|---|---|---|---|
| Previous Owner | Desnoyers Donna | $76,500 | |
| Previous Owner | Desnoyers Donna | $50,000 | |
| Previous Owner | Desnoyers Donna | $107,000 | |
| Previous Owner | Desnoyers Donna | $84,400 |
Source: Public Records
Tax History Compared to Growth
Tax History
| Year | Tax Paid | Tax Assessment Tax Assessment Total Assessment is a certain percentage of the fair market value that is determined by local assessors to be the total taxable value of land and additions on the property. | Land | Improvement |
|---|---|---|---|---|
| 2025 | $36 | $335,200 | $97,900 | $237,300 |
| 2024 | $3,440 | $301,500 | $93,700 | $207,800 |
| 2023 | $3,209 | $267,400 | $85,100 | $182,300 |
| 2022 | $3,081 | $232,200 | $80,900 | $151,300 |
| 2021 | $2,885 | $208,600 | $80,900 | $127,700 |
| 2020 | $2,908 | $208,600 | $80,900 | $127,700 |
| 2019 | $2,735 | $192,900 | $80,900 | $112,000 |
| 2018 | $2,782 | $192,900 | $80,900 | $112,000 |
| 2017 | $2,585 | $179,000 | $80,900 | $98,100 |
| 2016 | $2,602 | $179,100 | $80,900 | $98,200 |
| 2015 | $2,463 | $172,500 | $80,900 | $91,600 |
Source: Public Records
Map
Nearby Homes