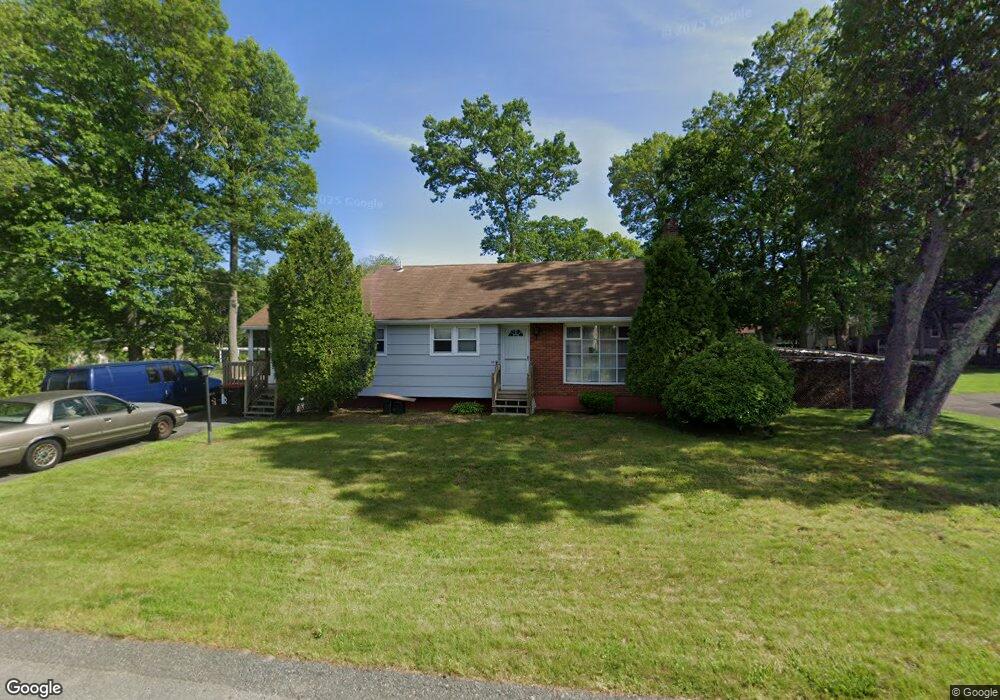
46 Highfield Dr Brockton, MA 02301
Clifton Heights NeighborhoodEstimated Value: $525,000 - $571,000
3
Beds
2
Baths
1,482
Sq Ft
$369/Sq Ft
Est. Value
About This Home
This home is located at 46 Highfield Dr, Brockton, MA 02301 and is currently estimated at $546,298, approximately $368 per square foot. 46 Highfield Dr is a home located in Plymouth County with nearby schools including Gilmore Elementary School, John F. Kennedy Elementary School, and Davis K-8 School.
Ownership History
Date
Name
Owned For
Owner Type
Purchase Details
Closed on
Mar 29, 1994
Sold by
Peterson Timothy and Peterson Glenda C
Bought by
Kidd Christopher
Current Estimated Value
Home Financials for this Owner
Home Financials are based on the most recent Mortgage that was taken out on this home.
Original Mortgage
$83,200
Interest Rate
7.15%
Mortgage Type
Purchase Money Mortgage
Create a Home Valuation Report for This Property
The Home Valuation Report is an in-depth analysis detailing your home's value as well as a comparison with similar homes in the area
Home Values in the Area
Average Home Value in this Area
Purchase History
| Date | Buyer | Sale Price | Title Company |
|---|---|---|---|
| Kidd Christopher | $104,000 | -- |
Source: Public Records
Mortgage History
| Date | Status | Borrower | Loan Amount |
|---|---|---|---|
| Closed | Kidd Christopher | $83,200 |
Source: Public Records
Tax History Compared to Growth
Tax History
| Year | Tax Paid | Tax Assessment Tax Assessment Total Assessment is a certain percentage of the fair market value that is determined by local assessors to be the total taxable value of land and additions on the property. | Land | Improvement |
|---|---|---|---|---|
| 2025 | $5,560 | $459,100 | $154,600 | $304,500 |
| 2024 | $5,356 | $445,600 | $154,600 | $291,000 |
| 2023 | $5,180 | $399,100 | $120,200 | $278,900 |
| 2022 | $4,841 | $346,500 | $109,600 | $236,900 |
| 2021 | $4,740 | $326,900 | $101,100 | $225,800 |
| 2020 | $4,430 | $292,400 | $96,800 | $195,600 |
| 2019 | $4,471 | $287,700 | $90,400 | $197,300 |
| 2018 | $4,147 | $258,200 | $90,400 | $167,800 |
| 2017 | $3,930 | $244,100 | $90,400 | $153,700 |
| 2016 | $3,967 | $228,500 | $86,700 | $141,800 |
| 2015 | $3,804 | $209,600 | $86,700 | $122,900 |
| 2014 | $3,586 | $197,800 | $86,700 | $111,100 |
Source: Public Records
Map
Nearby Homes
- 38 Highfield Dr
- 224 Linwood St
- 12 Linwood Park
- 234 Linwood St
- 20 Linwood Park
- 45 Highfield Dr
- 55 Highfield Dr
- 30 Highfield Dr
- 5 Linwood Park
- 30 Linwood Park
- 31 Highfield Dr
- 204 Linwood St
- 25 Linwood Park
- 221 Linwood St
- 250 Linwood St
- 22 Highfield Dr
- 12 Olde Farm Ln
- 14 Colleen Dr
- 25 Olde Farm Ln
- 8 Colleen Dr