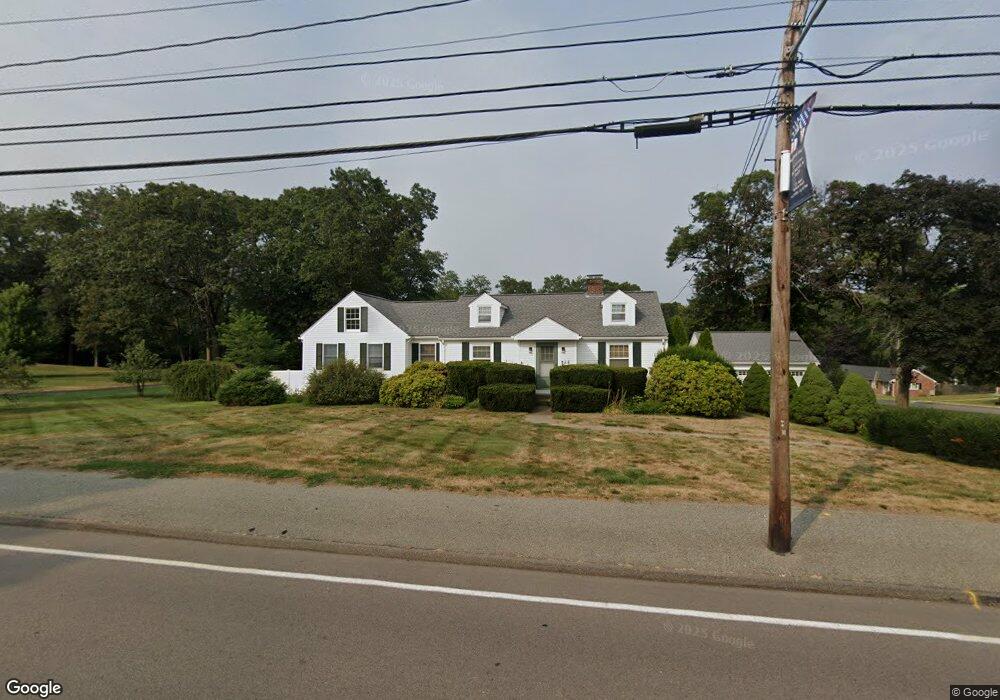
46 Holliston St Medway, MA 02053
Estimated Value: $653,526 - $816,000
3
Beds
2
Baths
2,200
Sq Ft
$334/Sq Ft
Est. Value
About This Home
This home is located at 46 Holliston St, Medway, MA 02053 and is currently estimated at $733,882, approximately $333 per square foot. 46 Holliston St is a home located in Norfolk County with nearby schools including John D. McGovern Elementary School, Burke-Memorial Elementary, and Medway Middle School.
Ownership History
Date
Name
Owned For
Owner Type
Purchase Details
Closed on
Jun 10, 2025
Sold by
Brown Kimberly A and Brown Robert N
Bought by
Brown Ret and Brown
Current Estimated Value
Purchase Details
Closed on
May 30, 2008
Sold by
Mancini Gabriel and Tiernan Theresa A
Bought by
Brown Kimberly A and Brown Robert N
Home Financials for this Owner
Home Financials are based on the most recent Mortgage that was taken out on this home.
Original Mortgage
$324,000
Interest Rate
5.91%
Mortgage Type
Purchase Money Mortgage
Purchase Details
Closed on
Apr 8, 1992
Sold by
Tiernan Kenneth R
Bought by
Tiernan Theresa A
Purchase Details
Closed on
Jul 19, 1988
Sold by
Haynes John E
Bought by
Haynes John E
Create a Home Valuation Report for This Property
The Home Valuation Report is an in-depth analysis detailing your home's value as well as a comparison with similar homes in the area
Home Values in the Area
Average Home Value in this Area
Purchase History
| Date | Buyer | Sale Price | Title Company |
|---|---|---|---|
| Brown Ret | -- | -- | |
| Brown Ret | -- | -- | |
| Brown Kimberly A | $360,000 | -- | |
| Brown Kimberly A | $360,000 | -- | |
| Tiernan Theresa A | $120,000 | -- | |
| Tiernan Theresa A | $120,000 | -- | |
| Haynes John E | $430,000 | -- |
Source: Public Records
Mortgage History
| Date | Status | Borrower | Loan Amount |
|---|---|---|---|
| Previous Owner | Haynes John E | $317,500 | |
| Previous Owner | Brown Kimberly A | $324,000 | |
| Previous Owner | Haynes John E | $11,000 |
Source: Public Records
Tax History Compared to Growth
Tax History
| Year | Tax Paid | Tax Assessment Tax Assessment Total Assessment is a certain percentage of the fair market value that is determined by local assessors to be the total taxable value of land and additions on the property. | Land | Improvement |
|---|---|---|---|---|
| 2025 | $8,134 | $570,800 | $273,000 | $297,800 |
| 2024 | $8,220 | $570,800 | $273,000 | $297,800 |
| 2023 | $7,766 | $487,200 | $235,200 | $252,000 |
| 2022 | $7,786 | $459,900 | $210,000 | $249,900 |
| 2021 | $7,415 | $424,700 | $189,000 | $235,700 |
| 2020 | $6,993 | $399,600 | $168,000 | $231,600 |
| 2019 | $6,469 | $381,200 | $168,000 | $213,200 |
| 2018 | $6,328 | $358,300 | $147,000 | $211,300 |
| 2017 | $6,130 | $342,100 | $136,500 | $205,600 |
| 2016 | $6,103 | $337,000 | $131,400 | $205,600 |
| 2015 | $5,532 | $303,300 | $123,900 | $179,400 |
| 2014 | $5,330 | $282,900 | $121,100 | $161,800 |
Source: Public Records
Map
Nearby Homes
- 50 Main St
- 3 Meryl St
- 20 Broad St Unit 6
- 20 Broad St Unit A
- 20 Broad St Unit 4
- 22 Sunset Dr
- 14 Sanford St Unit 15
- 9 Sanford St
- 106 Holliston St
- 280 Village St Unit D2
- 12 Lovering St
- 4 Shaw St
- 14 Heritage Dr
- 36 Lovering St
- 841 Lincoln St
- 28 Wellington St
- 176 Main St Unit 3
- 7 Gloucester Dr
- 0 Elm St
- 56 Fuller Place