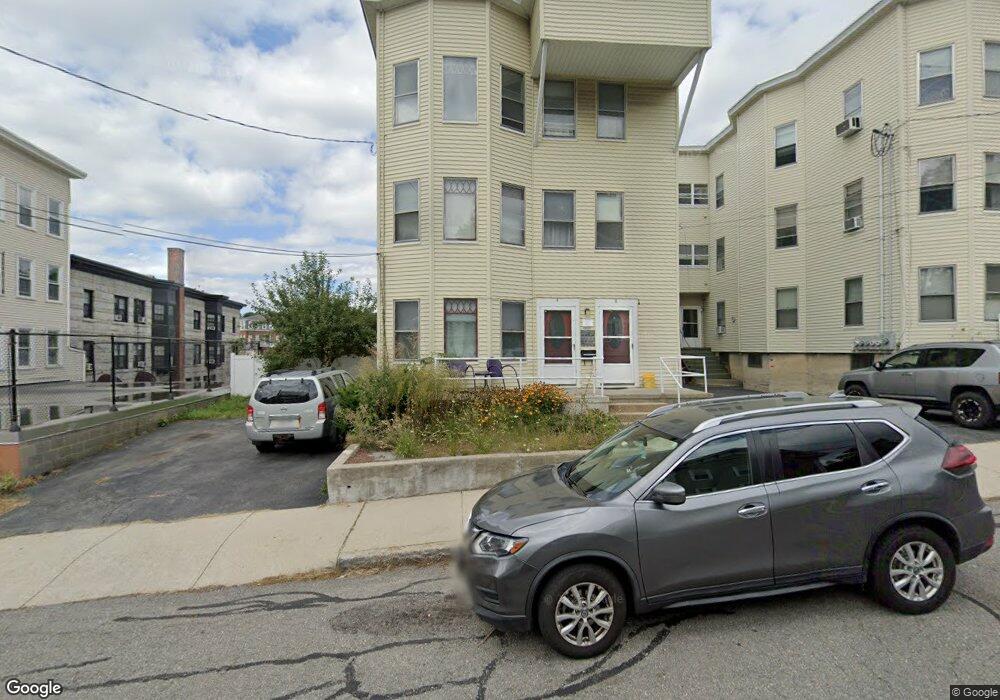
46 Holt St Fitchburg, MA 01420
Estimated Value: $591,000 - $816,000
6
Beds
3
Baths
4,113
Sq Ft
$164/Sq Ft
Est. Value
About This Home
This home is located at 46 Holt St, Fitchburg, MA 01420 and is currently estimated at $675,000, approximately $164 per square foot. 46 Holt St is a home located in Worcester County with nearby schools including South Street Elementary School, Crocker Elementary School, and Reingold Elementary School.
Ownership History
Date
Name
Owned For
Owner Type
Purchase Details
Closed on
Nov 15, 2022
Sold by
Moilanen Daideen F and Rumley Michael M
Bought by
M Jemms Fitchburg I Llc
Current Estimated Value
Home Financials for this Owner
Home Financials are based on the most recent Mortgage that was taken out on this home.
Original Mortgage
$700,000
Outstanding Balance
$678,174
Interest Rate
6.92%
Mortgage Type
Purchase Money Mortgage
Estimated Equity
-$3,174
Create a Home Valuation Report for This Property
The Home Valuation Report is an in-depth analysis detailing your home's value as well as a comparison with similar homes in the area
Home Values in the Area
Average Home Value in this Area
Purchase History
| Date | Buyer | Sale Price | Title Company |
|---|---|---|---|
| M Jemms Fitchburg I Llc | $700,000 | None Available | |
| M Jemms Fitchburg I Llc | $700,000 | None Available |
Source: Public Records
Mortgage History
| Date | Status | Borrower | Loan Amount |
|---|---|---|---|
| Open | M Jemms Fitchburg I Llc | $700,000 | |
| Closed | M Jemms Fitchburg I Llc | $700,000 |
Source: Public Records
Tax History Compared to Growth
Tax History
| Year | Tax Paid | Tax Assessment Tax Assessment Total Assessment is a certain percentage of the fair market value that is determined by local assessors to be the total taxable value of land and additions on the property. | Land | Improvement |
|---|---|---|---|---|
| 2025 | $6,208 | $459,500 | $85,800 | $373,700 |
| 2024 | $5,612 | $378,900 | $50,600 | $328,300 |
| 2023 | $5,472 | $341,600 | $38,800 | $302,800 |
| 2022 | $4,829 | $274,200 | $34,100 | $240,100 |
| 2021 | $4,341 | $228,100 | $25,900 | $202,200 |
| 2020 | $3,954 | $200,600 | $21,200 | $179,400 |
| 2019 | $3,168 | $154,600 | $29,400 | $125,200 |
| 2018 | $2,862 | $136,200 | $27,000 | $109,200 |
| 2017 | $2,723 | $126,700 | $24,700 | $102,000 |
| 2016 | $2,728 | $128,500 | $24,700 | $103,800 |
Source: Public Records
Map
Nearby Homes
- 15-25 Lunenburg St
- 4 Brigham Park
- 1 Avon Place
- 29 Brigham Park
- 56 Orange St
- 87 Summer St
- 36 2nd St
- 85 Boutelle St
- 25 Railroad St
- 168 Lunenburg St
- 206 Highland Ave
- 107 Summer St
- 29 Mount Vernon St
- 36 Jackson Ave
- 46 Jackson Ave
- 38-44 Granite St
- 208 Blossom St
- 133-137 Payson St
- 137 East St
- 94 Fitch Hill Ave
- 4 Holt St
- 10 Summer St Unit 12
- 16 Holt St Unit B
- 18 Holt St Unit A
- 18 Holt St
- 16 Holt St
- 16 Holt St Unit A
- 14 Holt St
- 15 Lunenburg St Unit 25
- 15 Lunenburg St
- 19 1/2 Lunenburg St Unit 2
- 19 1/2 Lunenburg St Unit 11
- 19 1/2 Lunenburg St Unit 10
- 19 1/2 Lunenburg St Unit 12
- 19 1/2 Lunenburg St Unit 8
- 19 1/2 Lunenburg St Unit 5
- 19 1/2 Lunenburg St Unit 6
- 19 Lunenburg St Unit 12
- 28 Summer St
- 28 Summer St Unit 2