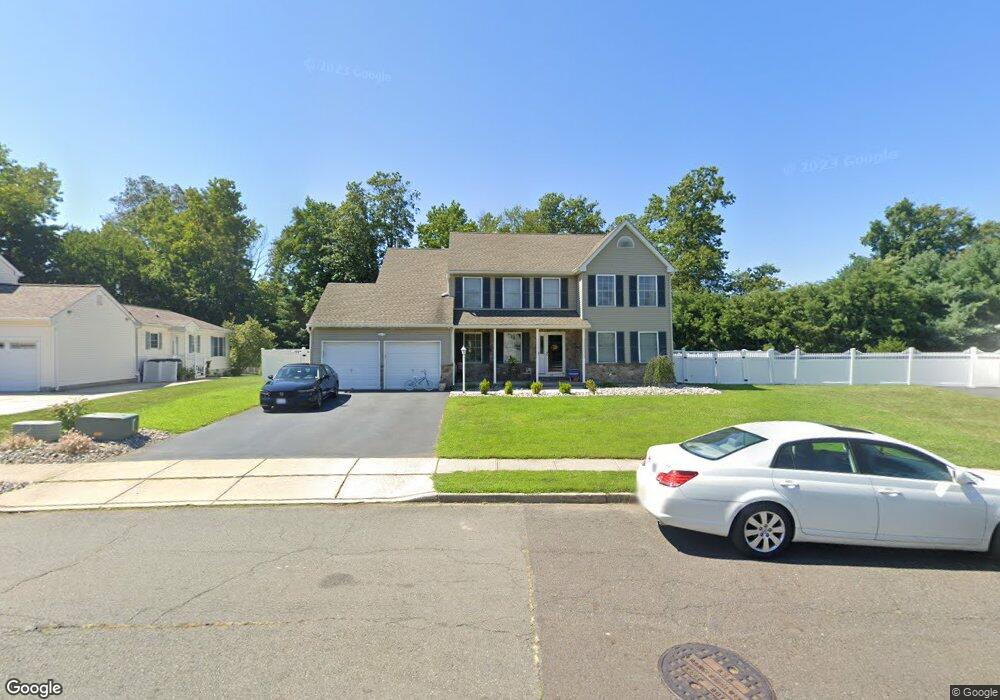
46 Klein Dr Trenton, NJ 08620
Estimated Value: $527,000 - $725,000
4
Beds
3
Baths
2,022
Sq Ft
$330/Sq Ft
Est. Value
About This Home
This home is located at 46 Klein Dr, Trenton, NJ 08620 and is currently estimated at $667,313, approximately $330 per square foot. 46 Klein Dr is a home located in Burlington County with nearby schools including Bordentown Reg High School and St Raphael School.
Ownership History
Date
Name
Owned For
Owner Type
Purchase Details
Closed on
Nov 6, 2008
Sold by
Nationstar Mortgage Llc
Bought by
Forster Ryan and Forster Jennifer
Current Estimated Value
Home Financials for this Owner
Home Financials are based on the most recent Mortgage that was taken out on this home.
Original Mortgage
$195,000
Outstanding Balance
$130,569
Interest Rate
6.49%
Mortgage Type
Purchase Money Mortgage
Estimated Equity
$536,744
Purchase Details
Closed on
Apr 11, 2008
Sold by
Coyle Elizabeth A and Simmons James J
Bought by
Nationstar Mortgage Llc
Purchase Details
Closed on
Dec 16, 1997
Sold by
Crestwood Construction Llc
Bought by
Coyle Elizabeth A and Simmons James J
Home Financials for this Owner
Home Financials are based on the most recent Mortgage that was taken out on this home.
Original Mortgage
$181,900
Interest Rate
6.9%
Create a Home Valuation Report for This Property
The Home Valuation Report is an in-depth analysis detailing your home's value as well as a comparison with similar homes in the area
Home Values in the Area
Average Home Value in this Area
Purchase History
| Date | Buyer | Sale Price | Title Company |
|---|---|---|---|
| Forster Ryan | $375,000 | General Abstract & Title Age | |
| Nationstar Mortgage Llc | -- | First American Title Ins Co | |
| Coyle Elizabeth A | $192,550 | -- |
Source: Public Records
Mortgage History
| Date | Status | Borrower | Loan Amount |
|---|---|---|---|
| Open | Forster Ryan | $195,000 | |
| Previous Owner | Coyle Elizabeth A | $181,900 |
Source: Public Records
Tax History Compared to Growth
Tax History
| Year | Tax Paid | Tax Assessment Tax Assessment Total Assessment is a certain percentage of the fair market value that is determined by local assessors to be the total taxable value of land and additions on the property. | Land | Improvement |
|---|---|---|---|---|
| 2025 | $13,435 | $349,600 | $95,400 | $254,200 |
| 2024 | $12,226 | $349,600 | $95,400 | $254,200 |
| 2023 | $12,226 | $349,600 | $95,400 | $254,200 |
| 2022 | $12,208 | $349,600 | $95,400 | $254,200 |
| 2021 | $11,827 | $331,000 | $95,400 | $235,600 |
| 2020 | $11,870 | $331,000 | $95,400 | $235,600 |
| 2019 | $11,595 | $331,000 | $95,400 | $235,600 |
| 2018 | $11,420 | $331,000 | $95,400 | $235,600 |
| 2017 | $11,211 | $331,000 | $95,400 | $235,600 |
| 2016 | $10,956 | $331,000 | $95,400 | $235,600 |
| 2015 | $10,605 | $331,000 | $95,400 | $235,600 |
| 2014 | $10,119 | $331,000 | $95,400 | $235,600 |
Source: Public Records
Map
Nearby Homes