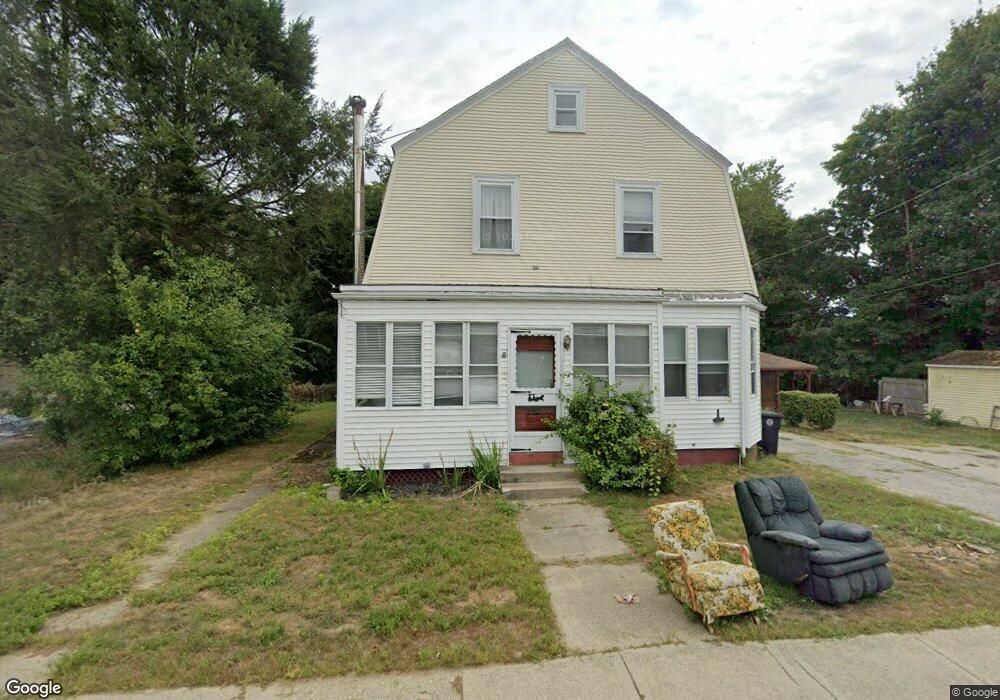
46 Laurel Ave Coventry, RI 02816
Estimated Value: $234,000 - $369,000
4
Beds
2
Baths
1,457
Sq Ft
$215/Sq Ft
Est. Value
About This Home
This home is located at 46 Laurel Ave, Coventry, RI 02816 and is currently estimated at $313,815, approximately $215 per square foot. 46 Laurel Ave is a home located in Kent County with nearby schools including Alan Shawn Feinstein Ms Of Cov, Coventry High School, and Father John V. Doyle School.
Ownership History
Date
Name
Owned For
Owner Type
Purchase Details
Closed on
Jul 17, 2025
Sold by
Ford Nancy L
Bought by
Sia Porgech
Current Estimated Value
Purchase Details
Closed on
Aug 4, 2011
Sold by
Coventy Town Of
Bought by
Ford Joseph M and Ford Nancy L
Create a Home Valuation Report for This Property
The Home Valuation Report is an in-depth analysis detailing your home's value as well as a comparison with similar homes in the area
Purchase History
| Date | Buyer | Sale Price | Title Company |
|---|---|---|---|
| Sia Porgech | $230,000 | -- | |
| Sia Porgech | $230,000 | -- | |
| Ford Joseph M | -- | -- | |
| Ford Joseph M | -- | -- |
Source: Public Records
Mortgage History
| Date | Status | Borrower | Loan Amount |
|---|---|---|---|
| Previous Owner | Ford Joseph M | $60,000 | |
| Previous Owner | Ford Joseph M | $40,000 |
Source: Public Records
Tax History
| Year | Tax Paid | Tax Assessment Tax Assessment Total Assessment is a certain percentage of the fair market value that is determined by local assessors to be the total taxable value of land and additions on the property. | Land | Improvement |
|---|---|---|---|---|
| 2025 | $5,149 | $320,000 | $109,200 | $210,800 |
| 2024 | $5,069 | $320,000 | $109,200 | $210,800 |
| 2023 | $4,906 | $320,000 | $109,200 | $210,800 |
| 2022 | $4,525 | $231,200 | $105,000 | $126,200 |
| 2021 | $4,485 | $231,200 | $105,000 | $126,200 |
| 2020 | $5,142 | $231,200 | $105,000 | $126,200 |
| 2019 | $4,455 | $200,300 | $88,100 | $112,200 |
| 2018 | $4,328 | $200,300 | $88,100 | $112,200 |
| 2017 | $4,202 | $200,300 | $88,100 | $112,200 |
| 2016 | $3,719 | $173,700 | $75,100 | $98,600 |
| 2015 | $3,618 | $173,700 | $75,100 | $98,600 |
| 2014 | $3,543 | $173,700 | $75,100 | $98,600 |
| 2013 | $3,370 | $180,600 | $88,800 | $91,800 |
Source: Public Records
Map
Nearby Homes
- 32 Pilgrim Ave
- 505 Washington St
- 513 Washington St
- 12 Hazard St
- 31 Anthony St Unit 33
- 91 Windsor Park Dr
- 123 Doolittle St
- 168 Knotty Oak Rd
- 58 Read Ave
- 15 Hope Ct
- 0 Beaulieu Ave
- 9 Regent St Unit 11
- 37 Holden St
- 33-35 Holden St
- 33 Holden St Unit 35
- 16 Morris St
- 37 West St
- 37 Phillip St
- 22 Wood St
- 1152 Main St Unit 1154
Your Personal Tour Guide
Ask me questions while you tour the home.