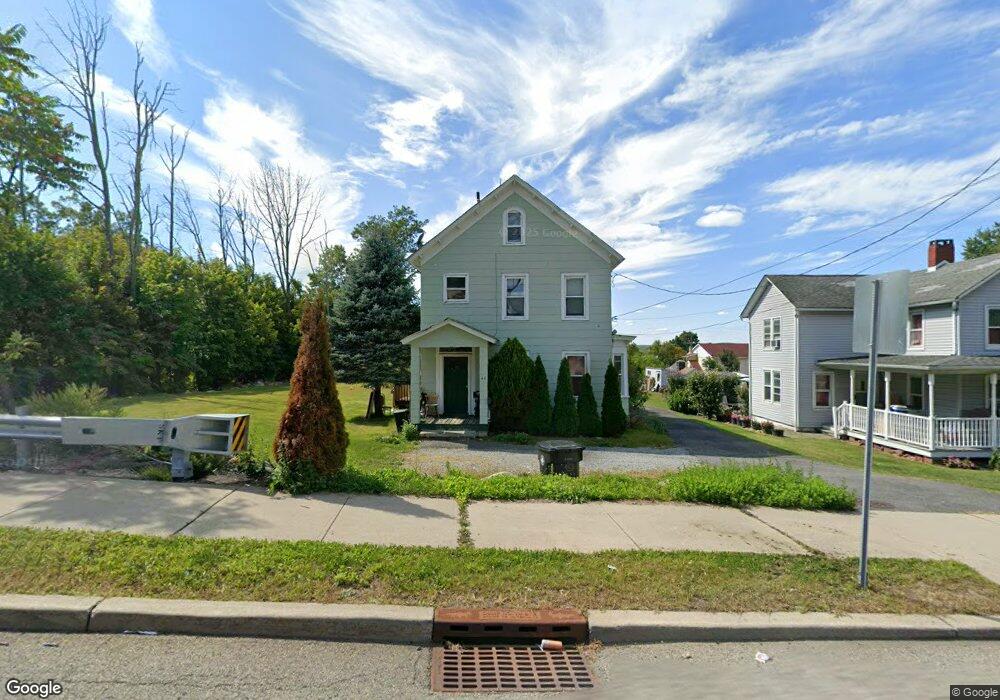
46 Ledgewood Ave Netcong, NJ 07857
Estimated Value: $393,500 - $490,000
Studio
--
Bath
1,497
Sq Ft
$303/Sq Ft
Est. Value
About This Home
This home is located at 46 Ledgewood Ave, Netcong, NJ 07857 and is currently estimated at $453,875, approximately $303 per square foot. 46 Ledgewood Ave is a home located in Morris County with nearby schools including Netcong Elementary School, Lenape Val Regional High School, and St. Therese School.
Ownership History
Date
Name
Owned For
Owner Type
Purchase Details
Closed on
Oct 18, 2011
Sold by
Howering Charles
Bought by
P & R Maisano Investments Limited Liabil
Current Estimated Value
Purchase Details
Closed on
Sep 8, 2009
Sold by
Howering Charles
Bought by
The State Of New Jersey Department Of Tr
Purchase Details
Closed on
Apr 9, 2001
Sold by
Hoewring Charles
Bought by
Boro Of Netcong
Create a Home Valuation Report for This Property
The Home Valuation Report is an in-depth analysis detailing your home's value as well as a comparison with similar homes in the area
Home Values in the Area
Average Home Value in this Area
Purchase History
| Date | Buyer | Sale Price | Title Company |
|---|---|---|---|
| P & R Maisano Investments Limited Liabil | $240,000 | None Available | |
| The State Of New Jersey Department Of Tr | $22,000 | None Available | |
| Boro Of Netcong | $2,800 | -- | |
| Boro Of Netcong | $2,800 | -- |
Source: Public Records
Tax History
| Year | Tax Paid | Tax Assessment Tax Assessment Total Assessment is a certain percentage of the fair market value that is determined by local assessors to be the total taxable value of land and additions on the property. | Land | Improvement |
|---|---|---|---|---|
| 2025 | $8,033 | $235,100 | $101,300 | $133,800 |
| 2024 | $8,104 | $235,100 | $101,300 | $133,800 |
Source: Public Records
Map
Nearby Homes
- 35 Hillside Ave
- 79 Main St
- 74 Main St
- 16-18 King St
- 8 Silas Rd
- 4 Elizabeth Ave
- 64 Spino Dr
- 9 Spino Dr
- 7 Walton Place
- 2 Roberts Place
- 8 Hillside Ave
- 0 Lawrence Ave
- 37 Fox Chase Ln
- 8 Spencer St
- 0 Swayze Pl Lawrence Ave
- 48 Old Budd Lake Rd
- 329 Alpine Ct Unit 29
- 573 Dell Place Unit 73
- 579 Dell Place Unit 79
- 1 Smith St
Your Personal Tour Guide
Ask me questions while you tour the home.