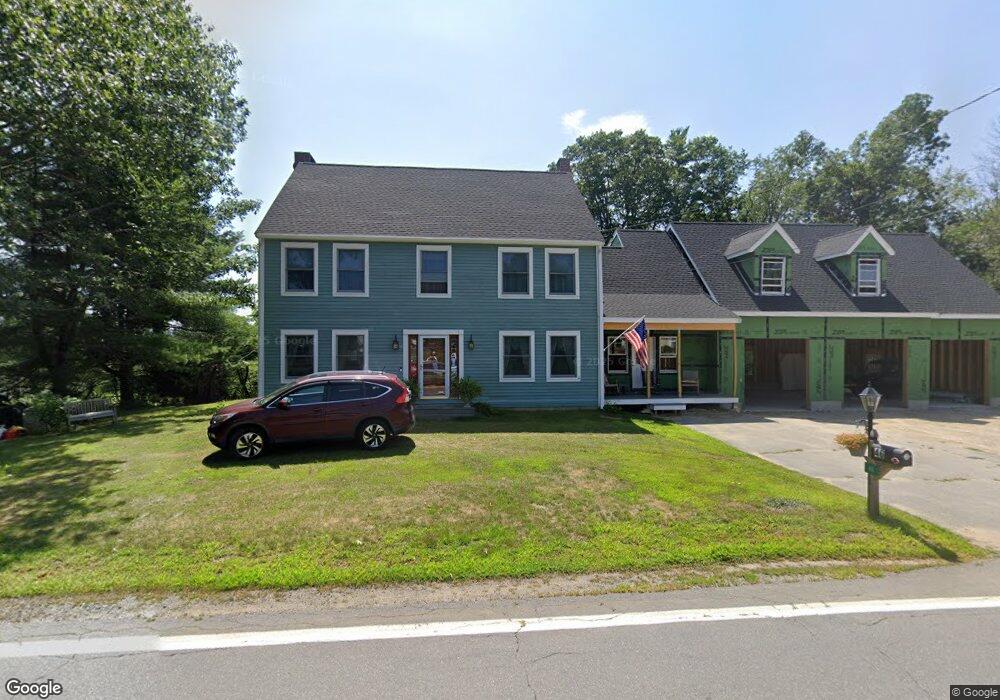
46 Main Ave South Hampton, NH 03827
Estimated Value: $616,072 - $804,000
3
Beds
3
Baths
2,477
Sq Ft
$281/Sq Ft
Est. Value
About This Home
This home is located at 46 Main Ave, South Hampton, NH 03827 and is currently estimated at $695,268, approximately $280 per square foot. 46 Main Ave is a home located in Rockingham County with nearby schools including South Hampton Barnard School, Winnacunnet High School, and Amesbury Seventh-Day Adventist School.
Ownership History
Date
Name
Owned For
Owner Type
Purchase Details
Closed on
Jun 2, 2016
Sold by
Bartczak Mcihael A and Bartczak Linda M
Bought by
Knight James B
Current Estimated Value
Create a Home Valuation Report for This Property
The Home Valuation Report is an in-depth analysis detailing your home's value as well as a comparison with similar homes in the area
Home Values in the Area
Average Home Value in this Area
Purchase History
| Date | Buyer | Sale Price | Title Company |
|---|---|---|---|
| Knight James B | -- | -- |
Source: Public Records
Tax History
| Year | Tax Paid | Tax Assessment Tax Assessment Total Assessment is a certain percentage of the fair market value that is determined by local assessors to be the total taxable value of land and additions on the property. | Land | Improvement |
|---|---|---|---|---|
| 2025 | $8,012 | $553,700 | $244,000 | $309,700 |
| 2024 | $7,776 | $563,500 | $244,000 | $319,500 |
| 2023 | $7,776 | $563,500 | $244,000 | $319,500 |
| 2022 | $7,461 | $375,700 | $147,300 | $228,400 |
| 2021 | $7,488 | $375,700 | $147,300 | $228,400 |
| 2020 | $7,135 | $375,700 | $147,300 | $228,400 |
| 2019 | $6,692 | $374,900 | $147,300 | $227,600 |
| 2018 | $6,250 | $374,900 | $147,300 | $227,600 |
| 2017 | $5,772 | $300,000 | $133,800 | $166,200 |
| 2016 | $5,480 | $300,600 | $134,400 | $166,200 |
| 2015 | $5,991 | $300,600 | $134,400 | $166,200 |
| 2014 | $5,621 | $300,600 | $134,400 | $166,200 |
| 2012 | $5,251 | $356,000 | $179,500 | $176,500 |
Source: Public Records
Map
Nearby Homes
Your Personal Tour Guide
Ask me questions while you tour the home.