46 Main St Newfields, NH 03856
Estimated Value: $709,000 - $1,240,000
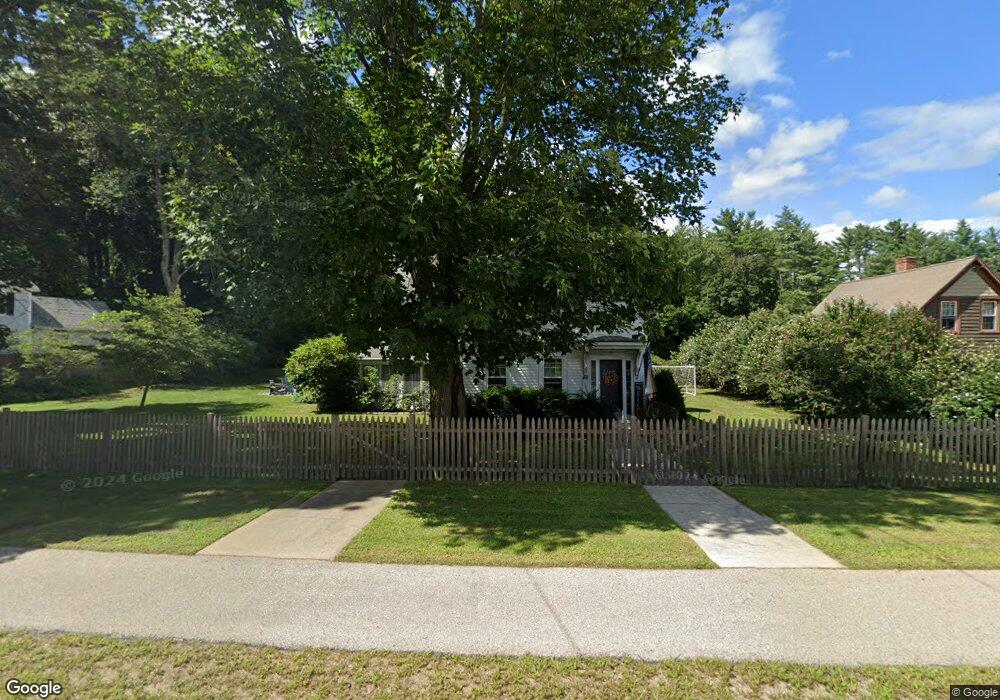
About This Home
This home is located at 46 Main St, Newfields, NH 03856 and is currently estimated at $875,283, approximately $254 per square foot. 46 Main St is a home located in Rockingham County with nearby schools including Newfields Elementary School, Cooperative Middle School, and Exeter High School.
Ownership History
We collect this data history from publicly available records. To have your information removed, we recommend requesting removal directly through your county’s website.
Purchase Details
Home Financials for this Owner
Home Financials are based on the most recent Mortgage that was taken out on this home.Home Values in the Area
Average Home Value in this Area
Purchase History
We collect this data history from publicly available records. To have your information removed, we recommend requesting removal directly through your county’s website.
| Date | Buyer | Sale Price | Title Company |
|---|---|---|---|
| $515,000 | None Available |
Mortgage History
We collect this data history from publicly available records. To have your information removed, we recommend requesting removal directly through your county’s website.
| Date | Status | Borrower | Loan Amount |
|---|---|---|---|
| Open | $412,000 |
Tax History
We collect this data history from publicly available records. To have your information removed, we recommend requesting removal directly through your county’s website.
| Year | Tax Paid | Tax Assessment Tax Assessment Total Assessment is a certain percentage of the fair market value that is determined by local assessors to be the total taxable value of land and additions on the property. | Land | Improvement |
|---|---|---|---|---|
| 2025 | $10,182 | $600,700 | $237,000 | $363,700 |
| 2024 | $9,665 | $600,700 | $237,000 | $363,700 |
| 2023 | $9,485 | $600,700 | $237,000 | $363,700 |
| 2022 | $9,111 | $434,700 | $173,500 | $261,200 |
| 2021 | $8,933 | $434,700 | $173,500 | $261,200 |
| 2020 | $9,233 | $434,700 | $173,500 | $261,200 |
| 2019 | $8,287 | $402,500 | $173,500 | $229,000 |
| 2018 | $7,956 | $400,800 | $173,500 | $227,300 |
| 2017 | $8,381 | $350,100 | $170,400 | $179,700 |
| 2016 | $9,028 | $388,800 | $170,400 | $218,400 |
| 2015 | $9,198 | $399,400 | $170,400 | $229,000 |
| 2014 | $9,685 | $399,400 | $170,400 | $229,000 |
| 2013 | $9,697 | $399,400 | $170,400 | $229,000 |
Map
- 85 College Rd
- 120 Exeter Rd
- 10 Pine Ct
- 36 Bassett Ln
- 43 Bassett Ln
- 38 Bassett Ln
- 104 Piscassic Rd
- 60 Peninsula Dr
- 63 Peninsula Dr
- 25 Peninsula Dr
- 21 Peninsula Dr
- 23 Winding Brook Dr
- 43 Ladyslipper Dr
- 14 Winding Brook Dr
- 29 Overlook Dr
- 137 Ash Swamp Rd
- 14 Squamscott Rd
- 00 Piscassic & Oaklands Rd Unit 1
- 3 Oak Ln
- 8 Laurel Ln
Ask me questions while you tour the home.