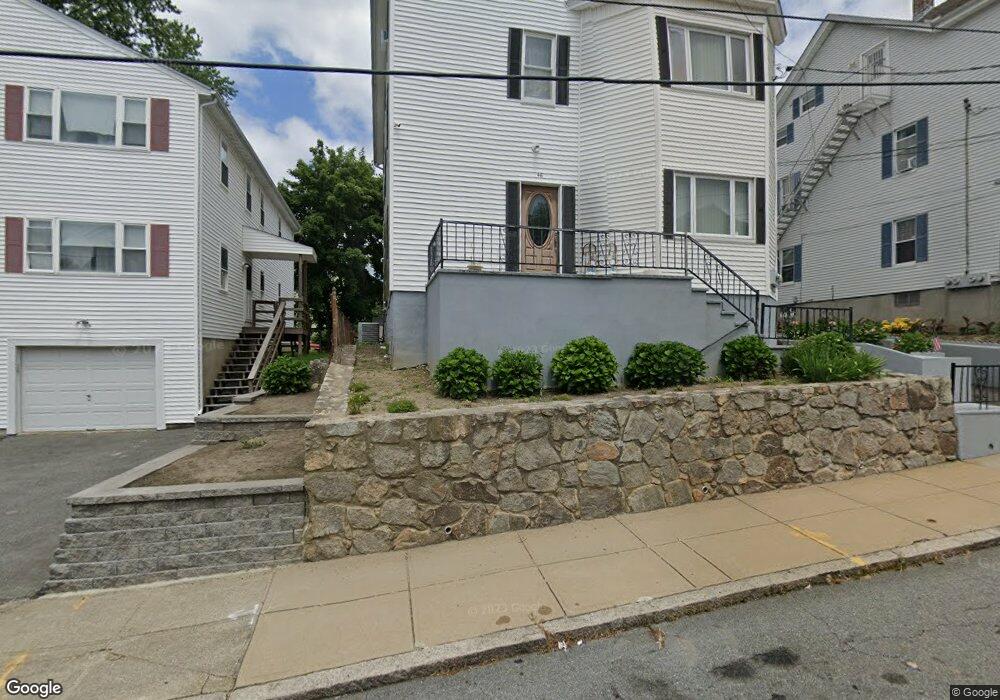
46 Manton St Fall River, MA 02724
Father Kelly NeighborhoodEstimated Value: $640,000 - $676,000
9
Beds
3
Baths
3,940
Sq Ft
$166/Sq Ft
Est. Value
About This Home
This home is located at 46 Manton St, Fall River, MA 02724 and is currently estimated at $652,667, approximately $165 per square foot. 46 Manton St is a home located in Bristol County with nearby schools including Henry Lord Community School, B M C Durfee High School, and Argosy Collegiate Charter School.
Ownership History
Date
Name
Owned For
Owner Type
Purchase Details
Closed on
Jun 13, 2014
Sold by
Arruda Carlos M and Arruda Maria R
Bought by
Arruda Ft
Current Estimated Value
Purchase Details
Closed on
Jun 28, 1978
Bought by
Arruda Carlos M and Arruda Maria R
Create a Home Valuation Report for This Property
The Home Valuation Report is an in-depth analysis detailing your home's value as well as a comparison with similar homes in the area
Home Values in the Area
Average Home Value in this Area
Purchase History
| Date | Buyer | Sale Price | Title Company |
|---|---|---|---|
| Arruda Ft | -- | -- | |
| Arruda Carlos M | $26,500 | -- |
Source: Public Records
Mortgage History
| Date | Status | Borrower | Loan Amount |
|---|---|---|---|
| Previous Owner | Arruda Carlos M | $11,648 | |
| Previous Owner | Arruda Carlos M | $100,000 | |
| Previous Owner | Arruda Carlos M | $10,000 | |
| Previous Owner | Arruda Carlos M | $15,000 |
Source: Public Records
Tax History
| Year | Tax Paid | Tax Assessment Tax Assessment Total Assessment is a certain percentage of the fair market value that is determined by local assessors to be the total taxable value of land and additions on the property. | Land | Improvement |
|---|---|---|---|---|
| 2025 | $7,420 | $648,000 | $108,100 | $539,900 |
| 2024 | $7,080 | $616,200 | $104,100 | $512,100 |
| 2023 | $6,296 | $513,100 | $86,000 | $427,100 |
| 2022 | $5,170 | $440,700 | $81,900 | $358,800 |
| 2021 | $5,170 | $373,800 | $77,900 | $295,900 |
| 2020 | $4,592 | $317,800 | $76,800 | $241,000 |
| 2019 | $3,870 | $265,400 | $74,000 | $191,400 |
| 2018 | $3,680 | $251,700 | $80,100 | $171,600 |
| 2017 | $3,471 | $247,900 | $76,300 | $171,600 |
| 2016 | $3,386 | $248,400 | $81,200 | $167,200 |
| 2015 | $3,249 | $248,400 | $81,200 | $167,200 |
| 2014 | $3,297 | $262,100 | $78,800 | $183,300 |
Source: Public Records
Map
Nearby Homes
- 58 Manton St
- 34 Manton St
- 559 Osborn St
- 68 Manton St
- 24 Manton St
- 541 Osborn St
- 47 Manton St
- 549 Osborn St
- 35 Manton St
- 33 Manton St Unit 35
- 563 Osborn St
- 563 Osborn St Unit 1
- 573 Osborn St
- 59 Manton St
- 529 Osborn St
- 82 Manton St Unit 1E
- 69 Manton St
- 581 Osborn St
- 79 Manton St
- 476 Whipple St Unit 478
Your Personal Tour Guide
Ask me questions while you tour the home.