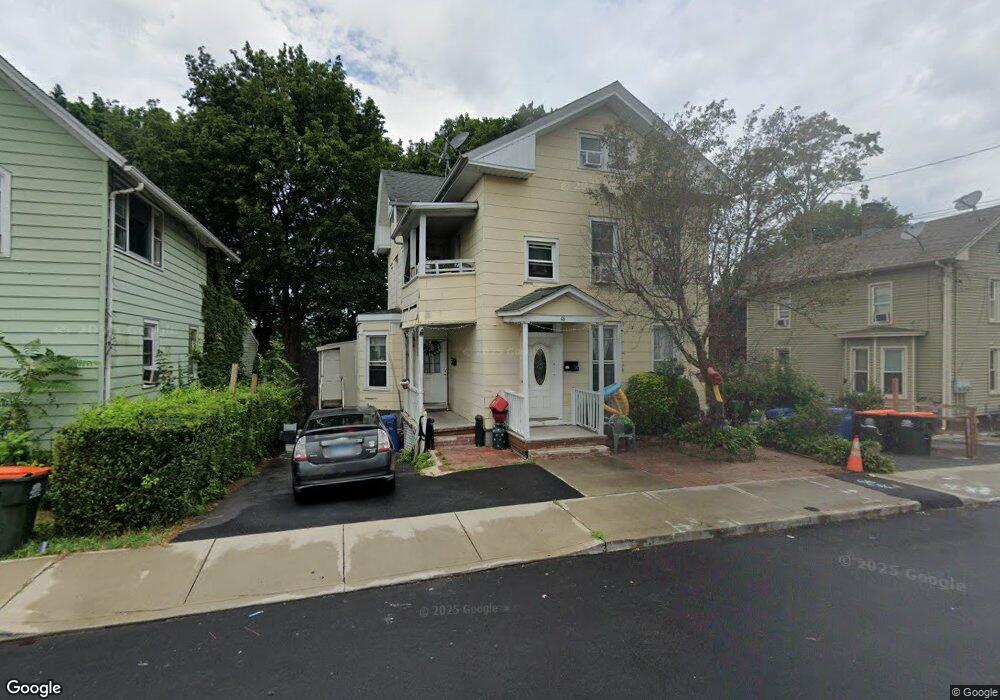
46 Maple St Meriden, CT 06451
Estimated Value: $274,000 - $359,000
8
Beds
3
Baths
2,430
Sq Ft
$134/Sq Ft
Est. Value
About This Home
This home is located at 46 Maple St, Meriden, CT 06451 and is currently estimated at $324,750, approximately $133 per square foot. 46 Maple St is a home located in New Haven County with nearby schools including John Barry School, Lincoln Middle School, and Orville H. Platt High School.
Ownership History
Date
Name
Owned For
Owner Type
Purchase Details
Closed on
Jan 30, 2007
Sold by
Creo Nestor
Bought by
Calixto Fernando and Calixto Jose
Current Estimated Value
Home Financials for this Owner
Home Financials are based on the most recent Mortgage that was taken out on this home.
Original Mortgage
$192,850
Outstanding Balance
$138,942
Interest Rate
10.3%
Estimated Equity
$185,808
Purchase Details
Closed on
Sep 17, 2004
Sold by
Villaneuva Marilyn and Villaneuva Luz M
Bought by
Creo Nestor
Home Financials for this Owner
Home Financials are based on the most recent Mortgage that was taken out on this home.
Original Mortgage
$105,600
Interest Rate
6.02%
Create a Home Valuation Report for This Property
The Home Valuation Report is an in-depth analysis detailing your home's value as well as a comparison with similar homes in the area
Home Values in the Area
Average Home Value in this Area
Purchase History
| Date | Buyer | Sale Price | Title Company |
|---|---|---|---|
| Calixto Fernando | $203,000 | -- | |
| Creo Nestor | $132,000 | -- |
Source: Public Records
Mortgage History
| Date | Status | Borrower | Loan Amount |
|---|---|---|---|
| Open | Creo Nestor | $192,850 | |
| Previous Owner | Creo Nestor | $105,600 | |
| Previous Owner | Creo Nestor | $39,747 |
Source: Public Records
Tax History
| Year | Tax Paid | Tax Assessment Tax Assessment Total Assessment is a certain percentage of the fair market value that is determined by local assessors to be the total taxable value of land and additions on the property. | Land | Improvement |
|---|---|---|---|---|
| 2025 | $4,554 | $120,120 | $25,130 | $94,990 |
| 2024 | $4,626 | $120,120 | $25,130 | $94,990 |
| 2023 | $4,459 | $120,120 | $25,130 | $94,990 |
| 2022 | $4,214 | $120,330 | $25,130 | $95,200 |
| 2021 | $3,593 | $82,530 | $21,140 | $61,390 |
| 2020 | $3,583 | $82,530 | $21,140 | $61,390 |
| 2019 | $3,552 | $82,530 | $21,140 | $61,390 |
| 2018 | $3,566 | $82,530 | $21,140 | $61,390 |
| 2017 | $3,471 | $82,530 | $21,140 | $61,390 |
| 2016 | $3,631 | $93,660 | $23,660 | $70,000 |
| 2015 | $3,631 | $93,660 | $23,660 | $70,000 |
| 2014 | $3,543 | $93,660 | $23,660 | $70,000 |
Source: Public Records
Map
Nearby Homes
- 55 Lewis Ave
- 49 Prospect St
- 14 North St
- 200 W Main St
- 230 W Main St
- 33 W Main St Unit 11
- 33 W Main St Unit 16
- 33 W Main St Unit 17
- 33 W Main St Unit 1
- 236 W Main St
- 171 Foster St
- 23 N 1st St
- 61 Randolph Ave
- 27 Windsor Ave
- 74 Randolph Ave
- 56 N First St
- 185 Springdale Ave
- 86 Linsley Ave
- 243 Grove St
- 44 4th St
Your Personal Tour Guide
Ask me questions while you tour the home.