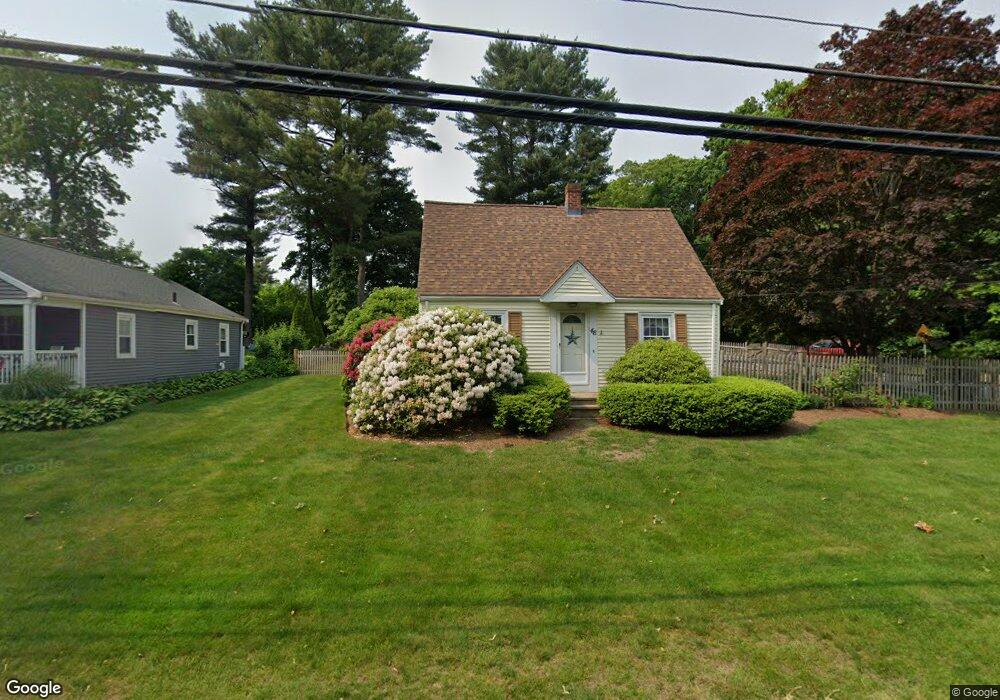
46 Matfield St West Bridgewater, MA 02379
Estimated Value: $530,000 - $560,000
2
Beds
2
Baths
1,328
Sq Ft
$407/Sq Ft
Est. Value
About This Home
This home is located at 46 Matfield St, West Bridgewater, MA 02379 and is currently estimated at $541,021, approximately $407 per square foot. 46 Matfield St is a home located in Plymouth County with nearby schools including Spring Street Elementary School, Howard Elementary School, and Rose L. MacDonald Elementary School.
Ownership History
Date
Name
Owned For
Owner Type
Purchase Details
Closed on
Jul 22, 2005
Sold by
White Richard T and White Kathleen M
Bought by
Ferretti Christine M
Current Estimated Value
Home Financials for this Owner
Home Financials are based on the most recent Mortgage that was taken out on this home.
Original Mortgage
$284,480
Outstanding Balance
$147,830
Interest Rate
5.59%
Mortgage Type
Purchase Money Mortgage
Estimated Equity
$393,191
Purchase Details
Closed on
Jul 31, 1998
Sold by
Caine John J and Caine Sheila R
Bought by
White Richard T and White Kathleen M
Purchase Details
Closed on
Jan 5, 1995
Sold by
Browman Forrest A
Bought by
Caine John J and Caine Sheila R
Purchase Details
Closed on
Aug 26, 1991
Sold by
Vayo Rick A and Vayo Linda J
Bought by
Broman Forest A
Create a Home Valuation Report for This Property
The Home Valuation Report is an in-depth analysis detailing your home's value as well as a comparison with similar homes in the area
Home Values in the Area
Average Home Value in this Area
Purchase History
| Date | Buyer | Sale Price | Title Company |
|---|---|---|---|
| Ferretti Christine M | $315,000 | -- | |
| White Richard T | $149,900 | -- | |
| Caine John J | $129,800 | -- | |
| Broman Forest A | $140,000 | -- |
Source: Public Records
Mortgage History
| Date | Status | Borrower | Loan Amount |
|---|---|---|---|
| Open | Broman Forest A | $284,480 | |
| Previous Owner | Broman Forest A | $153,500 | |
| Previous Owner | Broman Forest A | $25,000 |
Source: Public Records
Tax History Compared to Growth
Tax History
| Year | Tax Paid | Tax Assessment Tax Assessment Total Assessment is a certain percentage of the fair market value that is determined by local assessors to be the total taxable value of land and additions on the property. | Land | Improvement |
|---|---|---|---|---|
| 2025 | $6,171 | $451,400 | $195,800 | $255,600 |
| 2024 | $5,728 | $404,200 | $177,500 | $226,700 |
| 2023 | $5,244 | $341,200 | $153,700 | $187,500 |
| 2022 | $4,957 | $305,600 | $144,500 | $161,100 |
| 2021 | $4,918 | $294,300 | $144,500 | $149,800 |
| 2020 | $4,818 | $294,300 | $144,500 | $149,800 |
| 2019 | $4,818 | $291,500 | $144,500 | $147,000 |
| 2018 | $6,349 | $277,100 | $137,200 | $139,900 |
| 2017 | $4,721 | $259,900 | $124,400 | $135,500 |
| 2016 | $4,520 | $251,100 | $115,600 | $135,500 |
| 2015 | $4,221 | $237,000 | $115,600 | $121,400 |
| 2014 | $3,862 | $234,200 | $115,600 | $118,600 |
Source: Public Records
Map
Nearby Homes