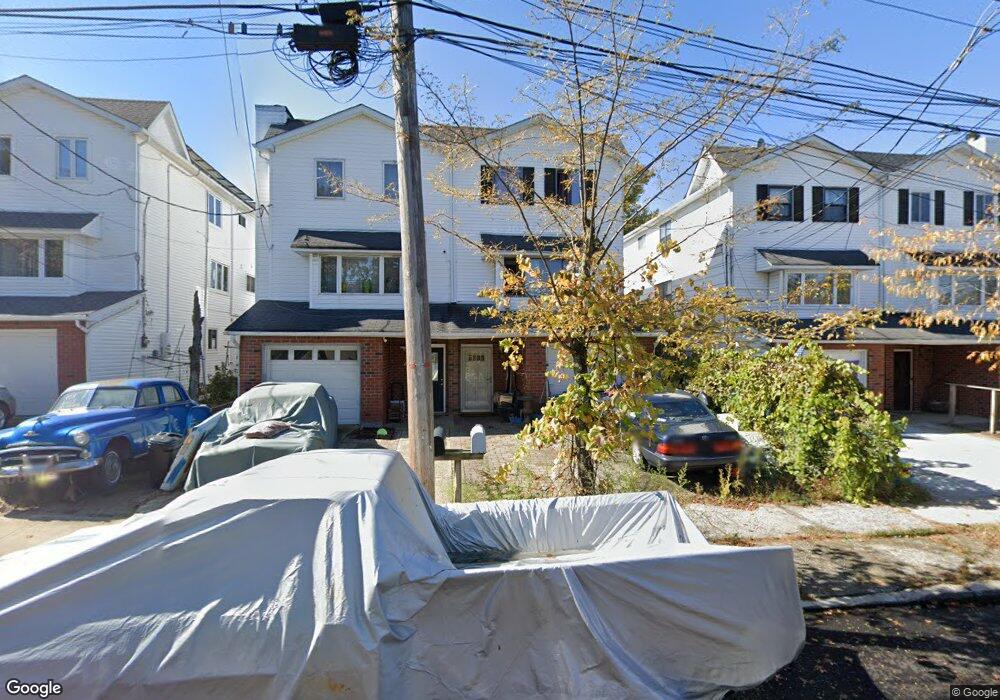
46 May Place Staten Island, NY 10312
Annadale NeighborhoodEstimated Value: $760,000 - $871,000
3
Beds
3
Baths
2,208
Sq Ft
$371/Sq Ft
Est. Value
About This Home
This home is located at 46 May Place, Staten Island, NY 10312 and is currently estimated at $818,171, approximately $370 per square foot. 46 May Place is a home located in Richmond County with nearby schools including P.S. 55 The Henry M. Boehm School, I.S. 007 Elias Bernstein, and Tottenville High School.
Ownership History
Date
Name
Owned For
Owner Type
Purchase Details
Closed on
Sep 5, 2007
Sold by
Boyle Richard
Bought by
Chechkin Oleg
Current Estimated Value
Home Financials for this Owner
Home Financials are based on the most recent Mortgage that was taken out on this home.
Original Mortgage
$344,000
Outstanding Balance
$219,244
Interest Rate
6.7%
Mortgage Type
Purchase Money Mortgage
Estimated Equity
$598,927
Create a Home Valuation Report for This Property
The Home Valuation Report is an in-depth analysis detailing your home's value as well as a comparison with similar homes in the area
Home Values in the Area
Average Home Value in this Area
Purchase History
| Date | Buyer | Sale Price | Title Company |
|---|---|---|---|
| Chechkin Oleg | $430,000 | Access Title Ins Agency Inc |
Source: Public Records
Mortgage History
| Date | Status | Borrower | Loan Amount |
|---|---|---|---|
| Open | Chechkin Oleg | $344,000 |
Source: Public Records
Tax History Compared to Growth
Tax History
| Year | Tax Paid | Tax Assessment Tax Assessment Total Assessment is a certain percentage of the fair market value that is determined by local assessors to be the total taxable value of land and additions on the property. | Land | Improvement |
|---|---|---|---|---|
| 2025 | $7,511 | $48,300 | $6,500 | $41,800 |
| 2024 | $7,511 | $44,400 | $6,671 | $37,729 |
| 2023 | $7,165 | $35,280 | $5,728 | $29,552 |
| 2022 | $6,727 | $39,660 | $7,920 | $31,740 |
| 2021 | $7,091 | $38,460 | $7,920 | $30,540 |
| 2020 | $6,992 | $41,220 | $7,920 | $33,300 |
| 2019 | $6,519 | $35,820 | $7,920 | $27,900 |
| 2018 | $5,993 | $29,400 | $7,920 | $21,480 |
| 2017 | $5,724 | $28,080 | $7,920 | $20,160 |
| 2016 | $5,903 | $29,527 | $7,466 | $22,061 |
| 2015 | $5,043 | $27,856 | $5,825 | $22,031 |
| 2014 | $5,043 | $26,280 | $6,600 | $19,680 |
Source: Public Records
Map
Nearby Homes