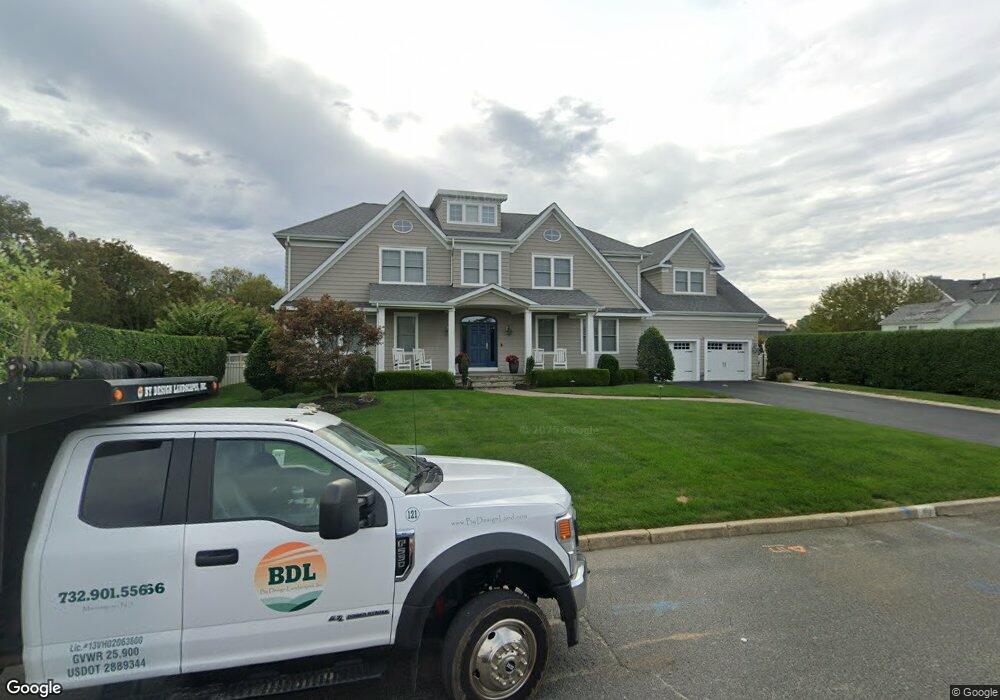
46 Meadow Ave Monmouth Beach, NJ 07750
Estimated Value: $1,681,000 - $3,225,000
5
Beds
4
Baths
5,192
Sq Ft
$512/Sq Ft
Est. Value
About This Home
This home is located at 46 Meadow Ave, Monmouth Beach, NJ 07750 and is currently estimated at $2,659,065, approximately $512 per square foot. 46 Meadow Ave is a home located in Monmouth County with nearby schools including Monmouth Beach School District, Shore Regional High School, and Holy Trinity School.
Ownership History
Date
Name
Owned For
Owner Type
Purchase Details
Closed on
Aug 1, 2011
Sold by
Bushinger Philip and Bushinger Sandi
Bought by
Bushiinger Philip and Bushinger Sandi
Current Estimated Value
Purchase Details
Closed on
Dec 18, 2002
Sold by
Schwartz Carol
Bought by
Bushinger Philip and Bushinger Sandi
Home Financials for this Owner
Home Financials are based on the most recent Mortgage that was taken out on this home.
Original Mortgage
$451,750
Outstanding Balance
$193,350
Interest Rate
6.19%
Estimated Equity
$2,465,715
Purchase Details
Closed on
Jul 30, 1999
Sold by
West Nicholas
Bought by
Schwartz Carol
Purchase Details
Closed on
Apr 20, 1994
Sold by
Carnesale Linda
Bought by
West Nicholas and West Jacqueline
Home Financials for this Owner
Home Financials are based on the most recent Mortgage that was taken out on this home.
Original Mortgage
$203,000
Interest Rate
7.6%
Create a Home Valuation Report for This Property
The Home Valuation Report is an in-depth analysis detailing your home's value as well as a comparison with similar homes in the area
Home Values in the Area
Average Home Value in this Area
Purchase History
| Date | Buyer | Sale Price | Title Company |
|---|---|---|---|
| Bushiinger Philip | -- | Lawyers Title Insurance Corp | |
| Bushinger Philip | $501,750 | -- | |
| Schwartz Carol | $573,500 | -- | |
| West Nicholas | $228,000 | -- |
Source: Public Records
Mortgage History
| Date | Status | Borrower | Loan Amount |
|---|---|---|---|
| Open | Bushinger Philip | $451,750 | |
| Previous Owner | West Nicholas | $203,000 |
Source: Public Records
Tax History Compared to Growth
Tax History
| Year | Tax Paid | Tax Assessment Tax Assessment Total Assessment is a certain percentage of the fair market value that is determined by local assessors to be the total taxable value of land and additions on the property. | Land | Improvement |
|---|---|---|---|---|
| 2025 | $15,475 | $1,704,600 | $565,900 | $1,138,700 |
| 2024 | $14,657 | $1,587,200 | $510,900 | $1,076,300 |
| 2023 | $14,657 | $1,423,000 | $497,600 | $925,400 |
| 2022 | $15,989 | $1,329,500 | $427,600 | $901,900 |
| 2021 | $15,989 | $1,259,000 | $367,600 | $891,400 |
| 2020 | $15,364 | $1,253,200 | $367,600 | $885,600 |
| 2019 | $14,821 | $1,233,000 | $342,600 | $890,400 |
| 2018 | $14,523 | $1,181,700 | $317,600 | $864,100 |
| 2017 | $14,167 | $1,117,300 | $288,600 | $828,700 |
| 2016 | $14,493 | $1,095,500 | $287,600 | $807,900 |
| 2015 | $15,665 | $1,246,200 | $307,600 | $938,600 |
| 2014 | $13,724 | $1,055,700 | $282,600 | $773,100 |
Source: Public Records
Map
Nearby Homes
- 25 Meadow Ave Unit 30
- 25 Spaulding Place
- 8 Mann Ct
- 79 Riverdale Ave
- 27 Ithaca Ave
- 580 Patten Ave Unit 48
- 580 Patten Ave Unit 62
- 580 Patten Ave Unit 86
- 580 Patten Ave Unit 31
- 1 Channel Dr Unit 705
- 1 Channel Dr Unit 709
- 1 Channel Dr Unit 1708
- 1 Channel Dr Unit 214
- 1 Channel Dr Unit 1705
- 9 Woolley St
- 8 Pocahontas Ave
- 16 Shore Dr
- 43 Valentine St
- 149 Wharfside Dr Unit 705
- 50 Valentine St Unit 27A
- 48 Meadow Ave
- 40 Meadow Ave
- 42 Meadow Ave
- 24 Highland Ave
- 26 Highland Ave
- 44 Meadow Ave
- 50 Meadow Ave
- 49 Meadow Ave
- 19 Highland Ave
- 28 Meadow Ave
- 28 Highland Ave
- 33 Highland Ave
- 24 Gull Point Rd
- 22 Gull Point Rd
- 26 Meadow Ave
- 30 Highland Ave
- 20 Gull Point Rd
- 20 Gull Point Rd Unit Annual
- 12 Highland Ave
- 32 Highland Ave