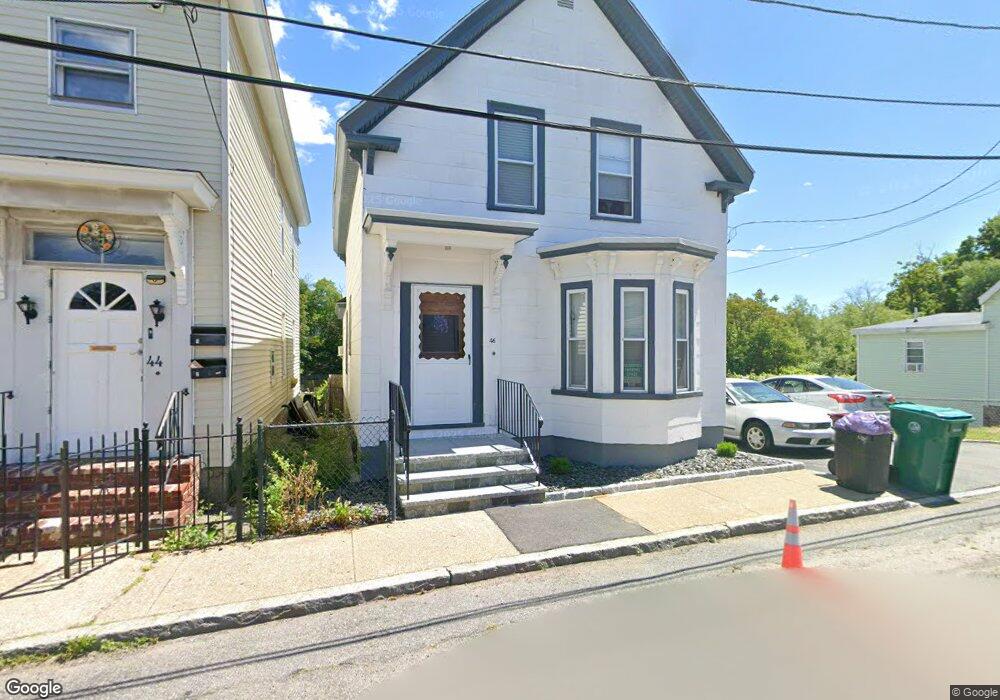
46 Merrill St Lowell, MA 01852
Back Central NeighborhoodEstimated Value: $403,000 - $473,000
3
Beds
1
Bath
1,330
Sq Ft
$320/Sq Ft
Est. Value
About This Home
This home is located at 46 Merrill St, Lowell, MA 01852 and is currently estimated at $426,259, approximately $320 per square foot. 46 Merrill St is a home located in Middlesex County with nearby schools including Moody Elementary School, Abraham Lincoln Elementary School, and Greenhalge Elementary School.
Ownership History
Date
Name
Owned For
Owner Type
Purchase Details
Closed on
Jul 21, 2015
Sold by
Cunha Alcinda M
Bought by
Carroll Susie M and Cunha Billy M
Current Estimated Value
Purchase Details
Closed on
Jul 25, 1984
Bought by
Cunha Alcinda M
Create a Home Valuation Report for This Property
The Home Valuation Report is an in-depth analysis detailing your home's value as well as a comparison with similar homes in the area
Home Values in the Area
Average Home Value in this Area
Purchase History
| Date | Buyer | Sale Price | Title Company |
|---|---|---|---|
| Carroll Susie M | -- | -- | |
| Carroll Susie M | -- | -- | |
| Cunha Alcinda M | $43,000 | -- |
Source: Public Records
Mortgage History
| Date | Status | Borrower | Loan Amount |
|---|---|---|---|
| Previous Owner | Cunha Alcinda M | $56,000 | |
| Previous Owner | Cunha Alcinda M | $26,800 | |
| Previous Owner | Cunha Alcinda M | $53,103 |
Source: Public Records
Tax History Compared to Growth
Tax History
| Year | Tax Paid | Tax Assessment Tax Assessment Total Assessment is a certain percentage of the fair market value that is determined by local assessors to be the total taxable value of land and additions on the property. | Land | Improvement |
|---|---|---|---|---|
| 2025 | $4,268 | $371,800 | $113,400 | $258,400 |
| 2024 | $4,120 | $345,900 | $102,300 | $243,600 |
| 2023 | $3,889 | $313,100 | $89,000 | $224,100 |
| 2022 | $3,449 | $271,800 | $70,200 | $201,600 |
| 2021 | $3,218 | $239,100 | $61,000 | $178,100 |
| 2020 | $2,912 | $218,000 | $50,900 | $167,100 |
| 2019 | $2,658 | $189,300 | $47,100 | $142,200 |
| 2018 | $2,597 | $180,500 | $44,800 | $135,700 |
| 2017 | $2,644 | $177,200 | $48,900 | $128,300 |
| 2016 | $2,524 | $166,500 | $49,200 | $117,300 |
| 2015 | $2,443 | $157,800 | $49,200 | $108,600 |
| 2013 | -- | $141,100 | $56,700 | $84,400 |
Source: Public Records
Map
Nearby Homes
- 31 Merrill St
- 24 Richmond Ave
- 9 Watson St
- 8 Clarks Ct
- 14 Watson St Unit 4
- 80 Rogers St Unit 204
- 46 Lyons St
- 88 Perry St
- 39 Groves Ave
- 43 Cedar St
- 7 Butler Ave Unit 5
- 8 Cedar Ct
- 66 Perry St
- 29 Pine Hill St Unit 29
- 200 Rogers St Unit 6
- 44 Hanks St
- 95 S Highland St
- 250 Nesmith St Unit 5
- 250 Nesmith St Unit 11
- 5 Lenox St Unit 2