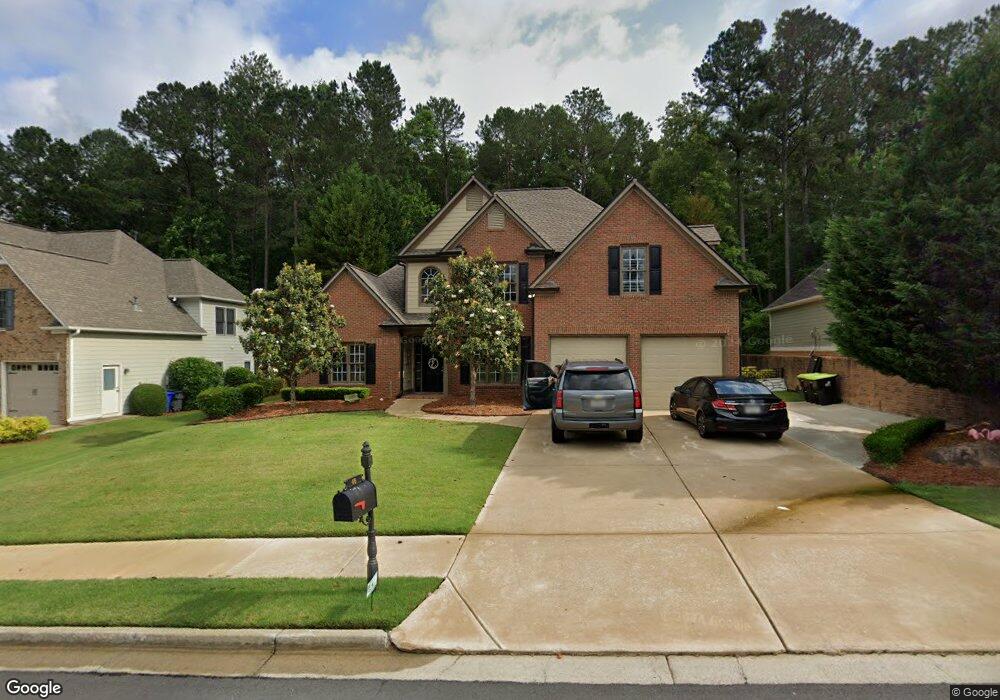
46 Misty View Ln Acworth, GA 30101
Cedarcrest NeighborhoodEstimated Value: $459,000 - $564,000
3
Beds
3
Baths
2,393
Sq Ft
$214/Sq Ft
Est. Value
About This Home
This home is located at 46 Misty View Ln, Acworth, GA 30101 and is currently estimated at $512,462, approximately $214 per square foot. 46 Misty View Ln is a home located in Paulding County with nearby schools including Floyd L. Shelton Elementary School at Crossroad, Sammy Mcclure Sr. Middle School, and North Paulding High School.
Ownership History
Date
Name
Owned For
Owner Type
Purchase Details
Closed on
Jun 1, 2021
Sold by
Williams Gregory K
Bought by
Eifert Tony James and Eifert Madylin Christine
Current Estimated Value
Home Financials for this Owner
Home Financials are based on the most recent Mortgage that was taken out on this home.
Original Mortgage
$382,936
Outstanding Balance
$346,701
Interest Rate
2.9%
Mortgage Type
FHA
Estimated Equity
$165,761
Purchase Details
Closed on
Oct 31, 2003
Sold by
Whittemore Homes Inc
Bought by
Williams Gregory K and Williams Gwynne
Home Financials for this Owner
Home Financials are based on the most recent Mortgage that was taken out on this home.
Original Mortgage
$47,300
Interest Rate
6%
Mortgage Type
Stand Alone Second
Create a Home Valuation Report for This Property
The Home Valuation Report is an in-depth analysis detailing your home's value as well as a comparison with similar homes in the area
Home Values in the Area
Average Home Value in this Area
Purchase History
| Date | Buyer | Sale Price | Title Company |
|---|---|---|---|
| Eifert Tony James | $390,000 | -- | |
| Williams Gregory K | $236,400 | -- |
Source: Public Records
Mortgage History
| Date | Status | Borrower | Loan Amount |
|---|---|---|---|
| Open | Eifert Tony James | $382,936 | |
| Previous Owner | Williams Gregory K | $47,300 | |
| Previous Owner | Williams Gregory K | $47,300 | |
| Previous Owner | Williams Gregory K | $189,000 |
Source: Public Records
Tax History Compared to Growth
Tax History
| Year | Tax Paid | Tax Assessment Tax Assessment Total Assessment is a certain percentage of the fair market value that is determined by local assessors to be the total taxable value of land and additions on the property. | Land | Improvement |
|---|---|---|---|---|
| 2024 | $5,238 | $210,592 | $26,000 | $184,592 |
| 2023 | $5,359 | $205,560 | $26,000 | $179,560 |
| 2022 | $4,067 | $166,616 | $26,000 | $140,616 |
| 2021 | $3,883 | $135,472 | $26,000 | $109,472 |
| 2020 | $3,803 | $129,908 | $26,000 | $103,908 |
| 2019 | $3,372 | $113,760 | $26,000 | $87,760 |
| 2018 | $3,436 | $115,920 | $26,000 | $89,920 |
| 2017 | $3,268 | $108,840 | $28,000 | $80,840 |
| 2016 | $3,187 | $107,280 | $28,000 | $79,280 |
| 2015 | $3,092 | $102,320 | $28,000 | $74,320 |
| 2014 | $2,978 | $96,200 | $28,000 | $68,200 |
| 2013 | -- | $77,760 | $28,000 | $49,760 |
Source: Public Records
Map
Nearby Homes
- 176 Nightwind Trace
- 76 Ashdowne Way
- 84 Cedarcrest Village Ln
- 118 Cedarcrest Village Ct
- 16 Hawkstone Ct
- 64 Cedarcrest Village Ct
- 179 Waterstone Point
- 416 Fairway Dr
- 427 Picketts Lake Dr
- 80 Lanier Ridge
- 216 Brisbane Dr
- 109 Applewood Ln
- 232 Clubhouse Crossing
- 184 Clubhouse Crossing
- 55 Clubhouse Way
- 26 Riverclub Rd
- 47 Vine Creek Ln
- 28 Misty View Ln
- 60 Misty View Ln
- 14 Misty View Ln
- 661 Golf Crest Dr
- 45 Misty View Ln
- 691 Golf Crest Dr
- 92 Misty View Ln
- 92 Misty View Ln Unit L
- 61 Misty View Ln
- 75 Misty View Ln
- 639 Golf Crest Dr
- 701 Golf Crest Dr
- 108 Misty View Ln
- 89 Misty View Ln
- 676 Golf Crest Dr
- 613 Golf Crest Dr Unit L
- 0 Misty View Ln Unit 7400583
- 0 Misty View Ln Unit 7085240
- 0 Misty View Ln Unit 3218942
- 0 Misty View Ln Unit 3202785