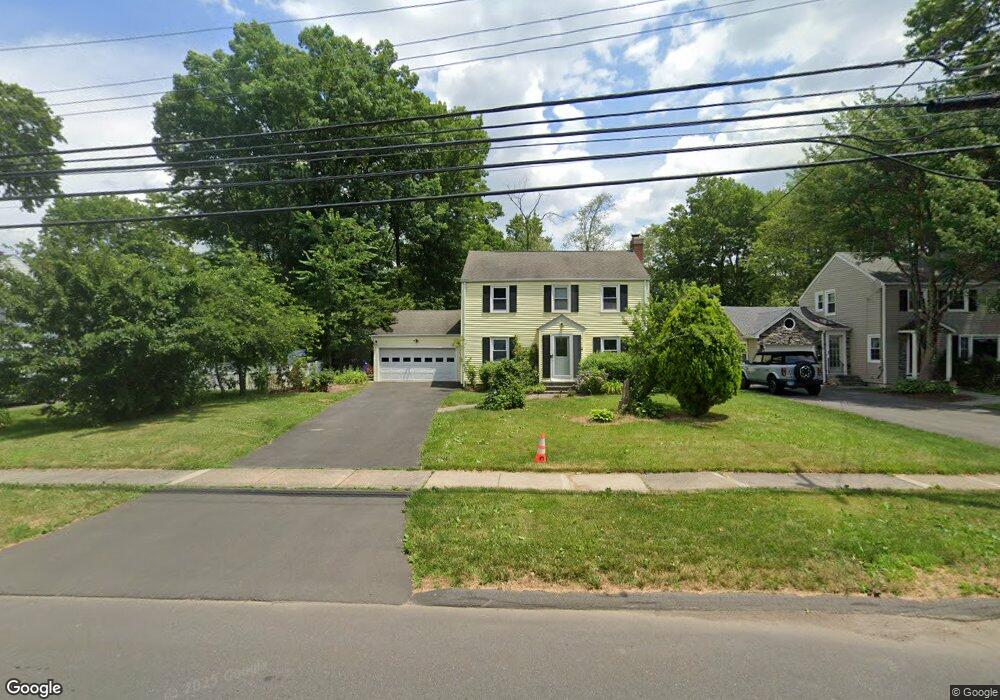
46 Mohegan Dr West Hartford, CT 06117
Estimated Value: $537,000 - $662,000
4
Beds
3
Baths
2,293
Sq Ft
$260/Sq Ft
Est. Value
About This Home
This home is located at 46 Mohegan Dr, West Hartford, CT 06117 and is currently estimated at $596,389, approximately $260 per square foot. 46 Mohegan Dr is a home located in Hartford County with nearby schools including Aiken School, King Philip Middle School, and Delta High School.
Ownership History
Date
Name
Owned For
Owner Type
Purchase Details
Closed on
Jul 22, 1996
Sold by
Mullen Martin and Mullen Mary
Bought by
Acosta Edder and Acosta Patria
Current Estimated Value
Home Financials for this Owner
Home Financials are based on the most recent Mortgage that was taken out on this home.
Original Mortgage
$134,700
Interest Rate
8.28%
Mortgage Type
Unknown
Purchase Details
Closed on
Oct 30, 1991
Sold by
Jr Norwood Richardson and Richardson Lena
Bought by
Withers Trevark and Withers Kathryn R
Create a Home Valuation Report for This Property
The Home Valuation Report is an in-depth analysis detailing your home's value as well as a comparison with similar homes in the area
Home Values in the Area
Average Home Value in this Area
Purchase History
| Date | Buyer | Sale Price | Title Company |
|---|---|---|---|
| Acosta Edder | $169,000 | -- | |
| Withers Trevark | $125,500 | -- |
Source: Public Records
Mortgage History
| Date | Status | Borrower | Loan Amount |
|---|---|---|---|
| Open | Withers Trevark | $152,000 | |
| Closed | Withers Trevark | $170,000 | |
| Closed | Withers Trevark | $134,700 | |
| Previous Owner | Withers Trevark | $163,600 |
Source: Public Records
Tax History Compared to Growth
Tax History
| Year | Tax Paid | Tax Assessment Tax Assessment Total Assessment is a certain percentage of the fair market value that is determined by local assessors to be the total taxable value of land and additions on the property. | Land | Improvement |
|---|---|---|---|---|
| 2025 | $12,021 | $268,450 | $78,890 | $189,560 |
| 2024 | $11,369 | $268,450 | $78,890 | $189,560 |
| 2023 | $10,985 | $268,450 | $78,890 | $189,560 |
| 2022 | $10,921 | $268,450 | $78,890 | $189,560 |
| 2021 | $10,078 | $237,580 | $70,980 | $166,600 |
| 2020 | $9,375 | $224,280 | $63,000 | $161,280 |
| 2019 | $9,375 | $224,280 | $63,000 | $161,280 |
| 2018 | $9,195 | $224,280 | $63,000 | $161,280 |
| 2017 | $9,204 | $224,280 | $63,000 | $161,280 |
| 2016 | $8,198 | $207,480 | $57,120 | $150,360 |
| 2015 | $7,949 | $207,480 | $57,120 | $150,360 |
| 2014 | $7,754 | $207,480 | $57,120 | $150,360 |
Source: Public Records
Map
Nearby Homes
- 139 Mohawk Dr
- 3 Pilgrim Rd
- 11 Lawler Rd
- 320 N Steele Rd
- 148 King Philip Dr
- 1993 Albany Ave
- 9 Timberwood Rd
- 62 Blue Ridge Ln
- 5 Adams Ln
- 5 Northmoor Rd
- 2581 Albany Ave
- 1272 Trout Brook Dr
- 50 Magnolia Hill
- 47 Flagg Rd
- 111 Bloomfield Ave
- 165 Bloomfield Ave
- 11 Rye Ridge Pkwy
- 2 Croydon Dr
- 132 N Main St
- 21 Barksdale Rd