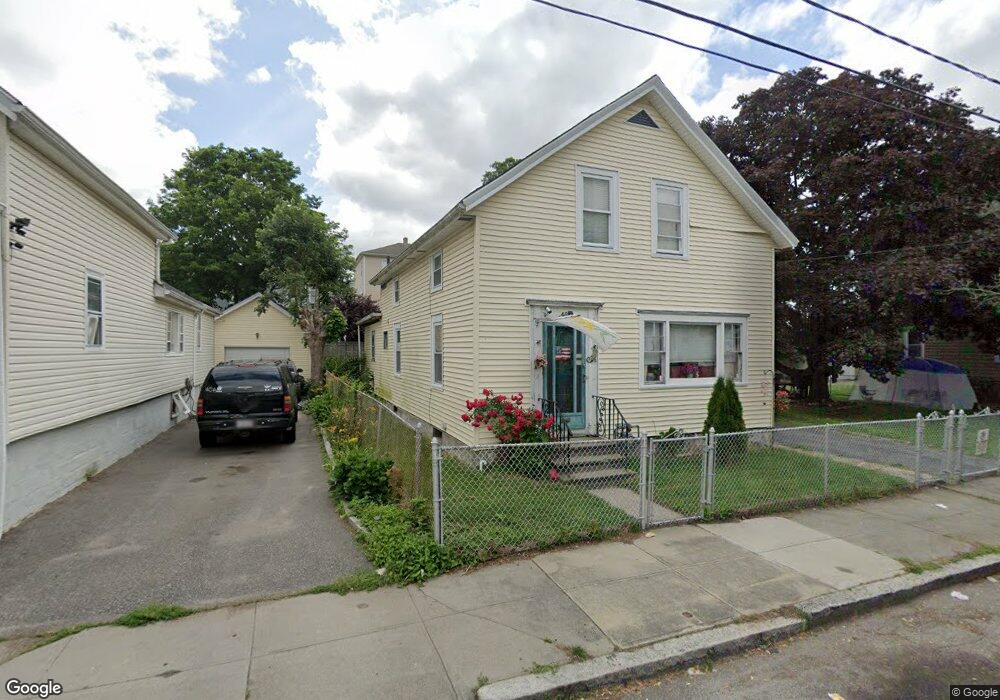
46 Montaup St Fall River, MA 02724
Father Kelly NeighborhoodEstimated Value: $368,000 - $397,979
4
Beds
1
Bath
1,622
Sq Ft
$235/Sq Ft
Est. Value
About This Home
This home is located at 46 Montaup St, Fall River, MA 02724 and is currently estimated at $380,745, approximately $234 per square foot. 46 Montaup St is a home located in Bristol County with nearby schools including Henry Lord Community School, B M C Durfee High School, and Argosy Collegiate Charter School.
Ownership History
Date
Name
Owned For
Owner Type
Purchase Details
Closed on
May 16, 2019
Sold by
Jordan Steven P and Jordan Louise J
Bought by
Jordan Steven P and Jordan Louise J
Current Estimated Value
Purchase Details
Closed on
Jul 24, 1980
Bought by
Jordan Steven P and Jordan Louise J
Create a Home Valuation Report for This Property
The Home Valuation Report is an in-depth analysis detailing your home's value as well as a comparison with similar homes in the area
Home Values in the Area
Average Home Value in this Area
Purchase History
| Date | Buyer | Sale Price | Title Company |
|---|---|---|---|
| Jordan Steven P | -- | -- | |
| Jordan Steven P | $32,000 | -- |
Source: Public Records
Mortgage History
| Date | Status | Borrower | Loan Amount |
|---|---|---|---|
| Previous Owner | Jordan Steven P | $26,000 | |
| Previous Owner | Jordan Steven P | $21,000 | |
| Previous Owner | Jordan Steven P | $10,000 |
Source: Public Records
Tax History
| Year | Tax Paid | Tax Assessment Tax Assessment Total Assessment is a certain percentage of the fair market value that is determined by local assessors to be the total taxable value of land and additions on the property. | Land | Improvement |
|---|---|---|---|---|
| 2025 | $3,540 | $309,200 | $105,000 | $204,200 |
| 2024 | $3,302 | $287,400 | $98,100 | $189,300 |
| 2023 | $2,963 | $241,500 | $82,300 | $159,200 |
| 2022 | $2,773 | $219,700 | $78,300 | $141,400 |
| 2021 | $2,593 | $187,500 | $75,000 | $112,500 |
| 2020 | $2,604 | $180,200 | $72,500 | $107,700 |
| 2019 | $2,543 | $174,400 | $72,500 | $101,900 |
| 2018 | $2,541 | $173,800 | $81,700 | $92,100 |
| 2017 | $2,369 | $169,200 | $77,900 | $91,300 |
| 2016 | $2,312 | $169,600 | $82,900 | $86,700 |
| 2015 | $2,218 | $169,600 | $82,900 | $86,700 |
| 2014 | $2,102 | $167,100 | $80,400 | $86,700 |
Source: Public Records
Map
Nearby Homes
- 40 Montaup St
- 64 Montaup St
- 47 Barrett St
- 43 Barrett St
- 43 Barrett St Unit 2
- 59 Barrett St
- 72 Montaup St
- 29 Barrett St
- 81 Barrett St
- 38 Mystic St
- 71 Mystic St
- 71 Mystic St Unit 8
- 71 Mystic St Unit 7
- 71 Mystic St Unit 6
- 71 Mystic St Unit 5
- 71 Mystic St Unit 2
- 71 Mystic St Unit 1
- 21 Barrett St
- 21 Barrett St Unit 1
- 21 Barrett St Unit 3
Your Personal Tour Guide
Ask me questions while you tour the home.