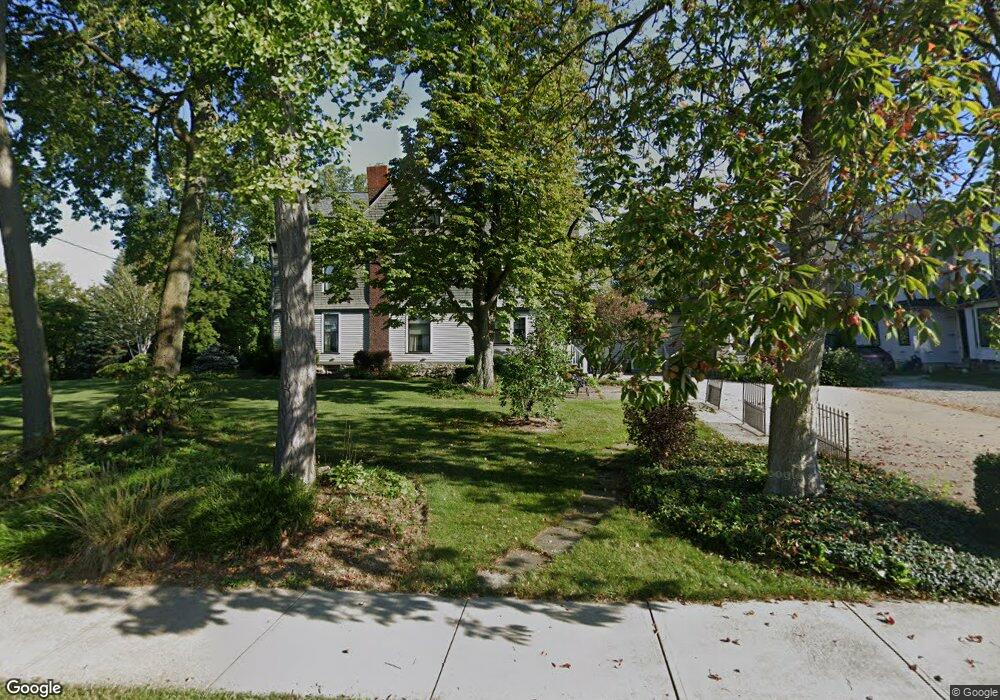
46 Morgan St Oberlin, OH 44074
Estimated Value: $412,000 - $638,000
6
Beds
7
Baths
5,446
Sq Ft
$96/Sq Ft
Est. Value
About This Home
This home is located at 46 Morgan St, Oberlin, OH 44074 and is currently estimated at $524,910, approximately $96 per square foot. 46 Morgan St is a home located in Lorain County with nearby schools including Oberlin Elementary School, Prospect Elementary School, and Langston Middle School.
Ownership History
Date
Name
Owned For
Owner Type
Purchase Details
Closed on
Apr 16, 2001
Sold by
Barr Doris M
Bought by
Marsh Marsha
Current Estimated Value
Home Financials for this Owner
Home Financials are based on the most recent Mortgage that was taken out on this home.
Original Mortgage
$210,000
Outstanding Balance
$77,587
Interest Rate
7.05%
Estimated Equity
$447,323
Create a Home Valuation Report for This Property
The Home Valuation Report is an in-depth analysis detailing your home's value as well as a comparison with similar homes in the area
Home Values in the Area
Average Home Value in this Area
Purchase History
We collect this data history from publicly available records. To have your information removed, we recommend requesting removal directly through your county’s website.
| Date | Buyer | Sale Price | Title Company |
|---|---|---|---|
| Marsh Marsha | -- | -- |
Source: Public Records
Mortgage History
We collect this data history from publicly available records. To have your information removed, we recommend requesting removal directly through your county’s website.
| Date | Status | Borrower | Loan Amount |
|---|---|---|---|
| Open | Marsh Marsha | $210,000 |
Source: Public Records
Tax History
| Year | Tax Paid | Tax Assessment Tax Assessment Total Assessment is a certain percentage of the fair market value that is determined by local assessors to be the total taxable value of land and additions on the property. | Land | Improvement |
|---|---|---|---|---|
| 2024 | $8,333 | $170,835 | $17,339 | $153,496 |
| 2023 | $5,437 | $99,575 | $25,960 | $73,616 |
| 2022 | $5,291 | $99,575 | $25,960 | $73,616 |
| 2021 | $5,269 | $99,575 | $25,960 | $73,616 |
| 2020 | $4,914 | $87,270 | $22,750 | $64,520 |
| 2019 | $4,861 | $87,270 | $22,750 | $64,520 |
| 2018 | $4,880 | $87,270 | $22,750 | $64,520 |
| 2017 | $4,862 | $86,970 | $24,060 | $62,910 |
| 2016 | $4,911 | $86,970 | $24,060 | $62,910 |
| 2015 | $4,916 | $86,970 | $24,060 | $62,910 |
| 2014 | $4,755 | $82,050 | $22,700 | $59,350 |
| 2013 | $4,675 | $82,050 | $22,700 | $59,350 |
Source: Public Records
Map
Nearby Homes
- 123 S Professor St
- 89 S Professor St
- 147 Morgan St
- 149 Morgan St
- 65 E Vine St
- 81 S Pleasant St
- 360 S Main St
- 0 S Park St
- 55 E College St Unit 212
- 65 E College St Unit 203
- 65 E College St
- VL Smith St
- 371 Washington Cir
- VL E Hamilton St
- 340 Edgemeer Place
- 182 E Hamilton St
- 136 N Park St
- 118 Hollywood St
- 216 N Main St
- 230 N Main St
Your Personal Tour Guide
Ask me questions while you tour the home.