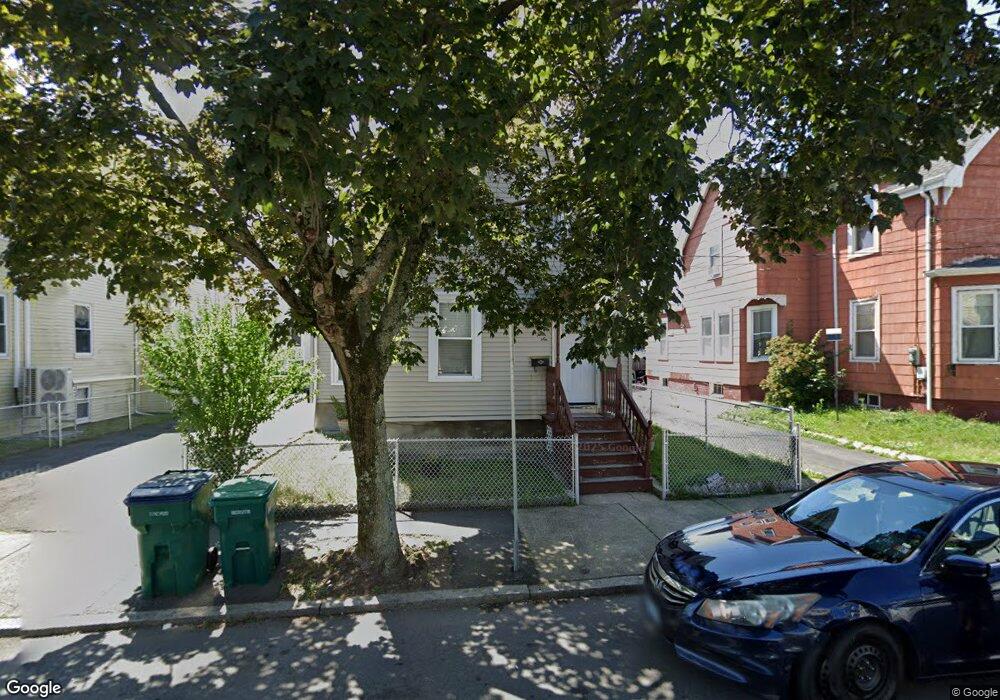
46 Moulton St Lynn, MA 01905
Lower Boston Street NeighborhoodEstimated Value: $444,000 - $565,000
3
Beds
2
Baths
1,255
Sq Ft
$424/Sq Ft
Est. Value
About This Home
This home is located at 46 Moulton St, Lynn, MA 01905 and is currently estimated at $532,222, approximately $424 per square foot. 46 Moulton St is a home located in Essex County with nearby schools including North Park Elementary School, William R. Fallon School, and Tracy Elementary School.
Ownership History
Date
Name
Owned For
Owner Type
Purchase Details
Closed on
Jan 10, 2000
Sold by
Stone Eric L and Crompton David A
Bought by
Mazil Alice
Current Estimated Value
Purchase Details
Closed on
Jul 22, 1999
Sold by
Meredith Linda and Meredith Dana H
Bought by
Stone Eric L
Create a Home Valuation Report for This Property
The Home Valuation Report is an in-depth analysis detailing your home's value as well as a comparison with similar homes in the area
Home Values in the Area
Average Home Value in this Area
Purchase History
| Date | Buyer | Sale Price | Title Company |
|---|---|---|---|
| Mazil Alice | $123,500 | -- | |
| Mazil Alice | $123,500 | -- | |
| Stone Eric L | $84,000 | -- | |
| Stone Eric L | $84,000 | -- |
Source: Public Records
Mortgage History
| Date | Status | Borrower | Loan Amount |
|---|---|---|---|
| Open | Stone Eric L | $236,791 | |
| Closed | Stone Eric L | $199,494 | |
| Closed | Stone Eric L | $10,000 |
Source: Public Records
Tax History Compared to Growth
Tax History
| Year | Tax Paid | Tax Assessment Tax Assessment Total Assessment is a certain percentage of the fair market value that is determined by local assessors to be the total taxable value of land and additions on the property. | Land | Improvement |
|---|---|---|---|---|
| 2025 | $5,245 | $506,300 | $189,100 | $317,200 |
| 2024 | $5,023 | $477,000 | $177,700 | $299,300 |
| 2023 | $4,836 | $433,700 | $172,200 | $261,500 |
| 2022 | $4,876 | $392,300 | $159,500 | $232,800 |
| 2021 | $4,820 | $369,900 | $153,100 | $216,800 |
| 2020 | $4,478 | $334,200 | $134,900 | $199,300 |
| 2019 | $4,259 | $297,800 | $110,400 | $187,400 |
| 2018 | $3,753 | $247,700 | $91,800 | $155,900 |
| 2017 | $3,493 | $223,900 | $77,800 | $146,100 |
| 2016 | $3,351 | $207,100 | $69,400 | $137,700 |
| 2015 | $3,090 | $184,500 | $64,700 | $119,800 |
Source: Public Records
Map
Nearby Homes