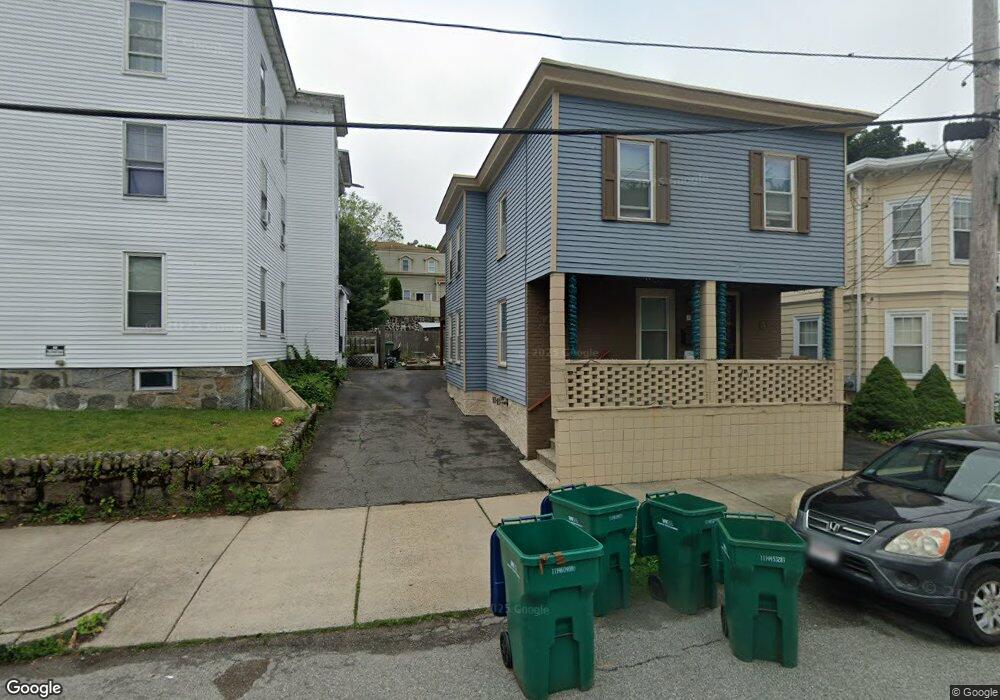
46 Mudge St Lynn, MA 01902
Eastern Avenue NeighborhoodEstimated Value: $662,004 - $784,000
4
Beds
2
Baths
1,912
Sq Ft
$383/Sq Ft
Est. Value
About This Home
This home is located at 46 Mudge St, Lynn, MA 01902 and is currently estimated at $733,001, approximately $383 per square foot. 46 Mudge St is a home located in Essex County with nearby schools including Aborn Elementary School, William R. Fallon School, and Marshall Middle School.
Ownership History
Date
Name
Owned For
Owner Type
Purchase Details
Closed on
Dec 16, 2016
Sold by
Chabot Ruth M and Perez Esther M
Bought by
Chabot Ruth M and Chabot Brian
Current Estimated Value
Home Financials for this Owner
Home Financials are based on the most recent Mortgage that was taken out on this home.
Original Mortgage
$324,328
Outstanding Balance
$272,905
Interest Rate
4.4%
Mortgage Type
FHA
Estimated Equity
$460,096
Purchase Details
Closed on
Oct 30, 2003
Sold by
Perez Mayra and Perez Victor J
Bought by
Perez Ruth M and Perez Esther M
Home Financials for this Owner
Home Financials are based on the most recent Mortgage that was taken out on this home.
Original Mortgage
$294,512
Interest Rate
6.05%
Mortgage Type
Purchase Money Mortgage
Purchase Details
Closed on
Jun 4, 2001
Sold by
West Tonya M and West Jay M
Bought by
Perez Victor J and Perez Mayra B
Home Financials for this Owner
Home Financials are based on the most recent Mortgage that was taken out on this home.
Original Mortgage
$215,616
Interest Rate
7.09%
Mortgage Type
Purchase Money Mortgage
Purchase Details
Closed on
Oct 1, 1999
Sold by
Mcdonough Mark J and Mcdonough Stephen P
Bought by
Brown Tonya M and West Jay M
Create a Home Valuation Report for This Property
The Home Valuation Report is an in-depth analysis detailing your home's value as well as a comparison with similar homes in the area
Home Values in the Area
Average Home Value in this Area
Purchase History
| Date | Buyer | Sale Price | Title Company |
|---|---|---|---|
| Chabot Ruth M | -- | -- | |
| Perez Ruth M | $312,000 | -- | |
| Perez Victor J | $219,000 | -- | |
| Brown Tonya M | $154,500 | -- |
Source: Public Records
Mortgage History
| Date | Status | Borrower | Loan Amount |
|---|---|---|---|
| Open | Chabot Ruth M | $324,328 | |
| Previous Owner | Mcdonough Michael J | $295,000 | |
| Previous Owner | Mcdonough Michael J | $294,512 | |
| Previous Owner | Mcdonough Michael J | $261,723 | |
| Previous Owner | Mcdonough Michael J | $215,616 |
Source: Public Records
Tax History
| Year | Tax Paid | Tax Assessment Tax Assessment Total Assessment is a certain percentage of the fair market value that is determined by local assessors to be the total taxable value of land and additions on the property. | Land | Improvement |
|---|---|---|---|---|
| 2025 | $6,304 | $608,470 | $191,700 | $416,770 |
| 2024 | $5,962 | $566,200 | $180,300 | $385,900 |
| 2023 | $5,985 | $536,800 | $177,800 | $359,000 |
| 2022 | $5,917 | $476,000 | $143,100 | $332,900 |
| 2021 | $5,444 | $417,800 | $121,000 | $296,800 |
| 2020 | $5,124 | $382,400 | $118,100 | $264,300 |
| 2019 | $4,974 | $347,800 | $110,400 | $237,400 |
| 2018 | $4,839 | $319,400 | $118,900 | $200,500 |
| 2017 | $4,352 | $279,000 | $98,100 | $180,900 |
| 2016 | $4,183 | $258,500 | $98,500 | $160,000 |
| 2015 | $4,032 | $240,700 | $98,500 | $142,200 |
Source: Public Records
Map
Nearby Homes
- 60 Roy St
- 4 Valley Rd Unit 4
- 16 Isabella St
- 129 Marianna St
- 80 Norfolk Ave Unit 1
- 30 Clifton Ave
- 106 Williams Ave
- 106 Norfolk Ave
- 146 Burrill St
- 21 E Park Ave
- 129 Williams Ave
- 50 Webster St
- 11 Boynton St Unit 104
- 11 Boynton St Unit 101
- 11 Boynton St Unit 103
- 11 Boynton St Unit 204
- 46 Stetson Ave
- 162 Chatham St
- 64 Stetson Ave
- 97 Seymour Ave
Your Personal Tour Guide
Ask me questions while you tour the home.