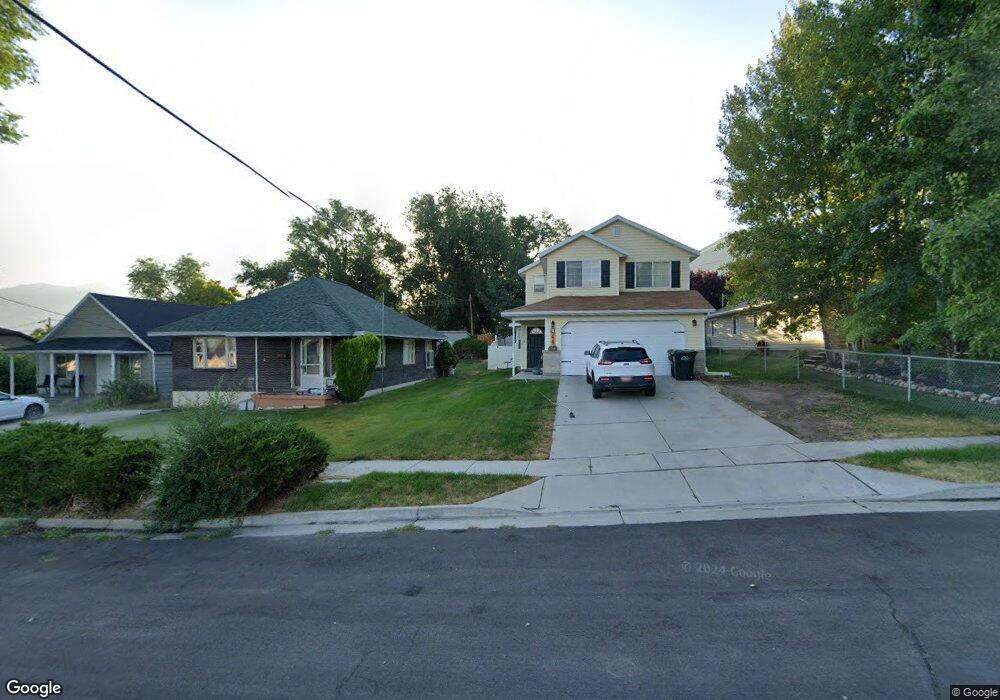
46 N 5th St Tooele, UT 84074
Estimated Value: $386,000 - $438,000
4
Beds
3
Baths
1,736
Sq Ft
$241/Sq Ft
Est. Value
About This Home
This home is located at 46 N 5th St, Tooele, UT 84074 and is currently estimated at $419,003, approximately $241 per square foot. 46 N 5th St is a home located in Tooele County with nearby schools including Sterling Elementary School, Tooele Junior High School, and Tooele High School.
Ownership History
Date
Name
Owned For
Owner Type
Purchase Details
Closed on
Jul 2, 2021
Sold by
Johnson Jeremiah and Johnson Rachel
Bought by
Rojas Leslie Ann
Current Estimated Value
Home Financials for this Owner
Home Financials are based on the most recent Mortgage that was taken out on this home.
Original Mortgage
$326,250
Outstanding Balance
$296,021
Interest Rate
2.9%
Mortgage Type
New Conventional
Estimated Equity
$122,982
Purchase Details
Closed on
Oct 25, 2019
Sold by
Mitchell Melissa and Mitchell Wade
Bought by
Johnson Jeremiah and Johnson Rachel
Home Financials for this Owner
Home Financials are based on the most recent Mortgage that was taken out on this home.
Original Mortgage
$220,924
Interest Rate
3.7%
Mortgage Type
FHA
Purchase Details
Closed on
Apr 29, 2016
Sold by
Mitchell Melissa
Bought by
Mitchell Melissa and Mitchell Wade
Create a Home Valuation Report for This Property
The Home Valuation Report is an in-depth analysis detailing your home's value as well as a comparison with similar homes in the area
Home Values in the Area
Average Home Value in this Area
Purchase History
| Date | Buyer | Sale Price | Title Company |
|---|---|---|---|
| Rojas Leslie Ann | -- | Titan Title Insurance Agency | |
| Johnson Jeremiah | -- | Novation Title Ins Agcy | |
| Mitchell Melissa | -- | Accommodation |
Source: Public Records
Mortgage History
| Date | Status | Borrower | Loan Amount |
|---|---|---|---|
| Open | Rojas Leslie Ann | $326,250 | |
| Previous Owner | Johnson Jeremiah | $220,924 |
Source: Public Records
Tax History Compared to Growth
Tax History
| Year | Tax Paid | Tax Assessment Tax Assessment Total Assessment is a certain percentage of the fair market value that is determined by local assessors to be the total taxable value of land and additions on the property. | Land | Improvement |
|---|---|---|---|---|
| 2025 | $2,689 | $224,248 | $45,760 | $178,488 |
| 2024 | $2,781 | $212,276 | $45,760 | $166,516 |
| 2023 | $2,781 | $185,447 | $44,557 | $140,890 |
| 2022 | $2,206 | $189,762 | $54,780 | $134,982 |
| 2021 | $2,008 | $144,505 | $36,520 | $107,985 |
| 2020 | $1,875 | $234,087 | $37,750 | $196,337 |
| 2019 | $1,761 | $216,238 | $37,750 | $178,488 |
| 2018 | $1,643 | $191,261 | $40,000 | $151,261 |
| 2017 | $1,071 | $147,973 | $18,000 | $129,973 |
| 2016 | $244 | $76,946 | $9,900 | $67,046 |
| 2014 | $244 | $21,177 | $0 | $0 |
Source: Public Records
Map
Nearby Homes
- 390 E Vine St
- 440 Highland Dr
- 134 S 4th St
- 430 E Utah Ave
- 656 E 220 N
- 124 N 1st St
- 131 N 1st St
- 5 S Bench Mark Village Unit 5
- 230 N 2nd St
- 142 N Pinehurst Ave
- 192 E 100 S
- 141 N Pinehurst Ave
- 828 E Vine St
- 684 Oquirrh Ave
- 11 Benchmark Village
- 161 E 200 S
- 160 E 230 N
- 156 S 200 E
- 87 Glenwood Ave
- 184 S 200 E