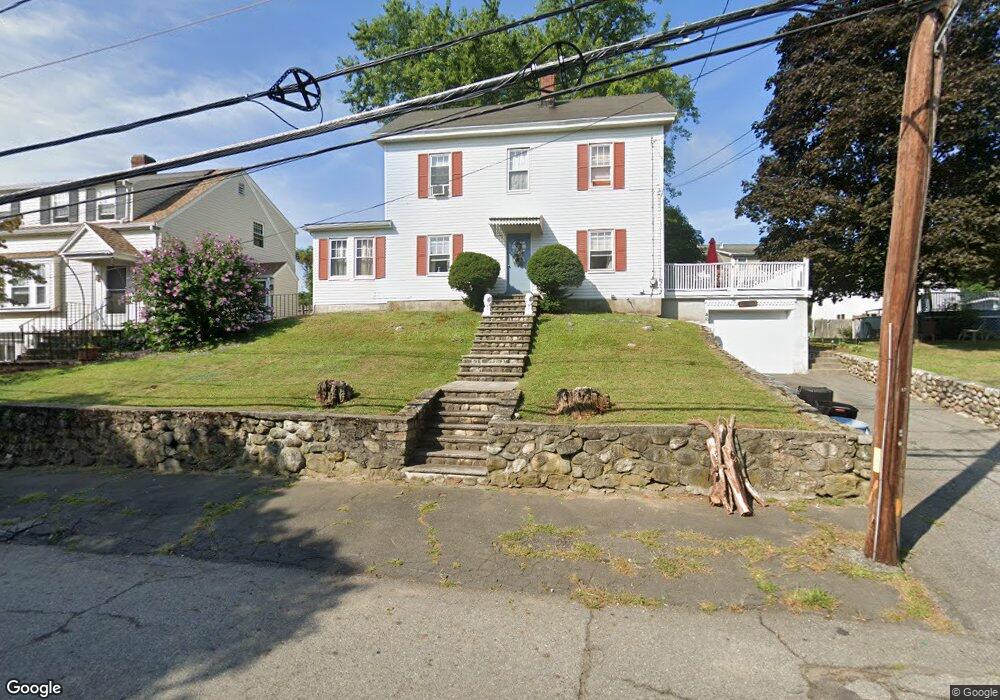
46 N Warren St Woburn, MA 01801
Downtown Woburn NeighborhoodEstimated Value: $733,000 - $886,000
4
Beds
2
Baths
1,792
Sq Ft
$453/Sq Ft
Est. Value
About This Home
This home is located at 46 N Warren St, Woburn, MA 01801 and is currently estimated at $812,188, approximately $453 per square foot. 46 N Warren St is a home located in Middlesex County with nearby schools including Hurld Elementary School, Daniel L. Joyce Middle School, and Woburn High School.
Ownership History
Date
Name
Owned For
Owner Type
Purchase Details
Closed on
Apr 20, 1999
Sold by
Paris Jeanne C Est and Maher
Bought by
Manzi Edward A and Manzi Lisa M
Current Estimated Value
Home Financials for this Owner
Home Financials are based on the most recent Mortgage that was taken out on this home.
Original Mortgage
$163,200
Interest Rate
7.04%
Mortgage Type
Purchase Money Mortgage
Create a Home Valuation Report for This Property
The Home Valuation Report is an in-depth analysis detailing your home's value as well as a comparison with similar homes in the area
Home Values in the Area
Average Home Value in this Area
Purchase History
| Date | Buyer | Sale Price | Title Company |
|---|---|---|---|
| Manzi Edward A | $192,000 | -- |
Source: Public Records
Mortgage History
| Date | Status | Borrower | Loan Amount |
|---|---|---|---|
| Open | Manzi Edward A | $165,000 | |
| Closed | Manzi Edward A | $163,200 |
Source: Public Records
Tax History Compared to Growth
Tax History
| Year | Tax Paid | Tax Assessment Tax Assessment Total Assessment is a certain percentage of the fair market value that is determined by local assessors to be the total taxable value of land and additions on the property. | Land | Improvement |
|---|---|---|---|---|
| 2025 | $5,788 | $677,700 | $308,900 | $368,800 |
| 2024 | $4,822 | $598,300 | $294,200 | $304,100 |
| 2023 | $4,859 | $558,500 | $267,500 | $291,000 |
| 2022 | $4,675 | $500,500 | $232,700 | $267,800 |
| 2021 | $4,296 | $460,500 | $221,700 | $238,800 |
| 2020 | $4,278 | $459,000 | $221,700 | $237,300 |
| 2019 | $5,883 | $443,100 | $211,200 | $231,900 |
| 2018 | $3,919 | $396,300 | $193,900 | $202,400 |
| 2017 | $5,096 | $360,600 | $184,700 | $175,900 |
| 2016 | $3,421 | $340,400 | $172,700 | $167,700 |
| 2015 | $3,292 | $323,700 | $161,400 | $162,300 |
| 2014 | $3,208 | $307,300 | $161,400 | $145,900 |
Source: Public Records
Map
Nearby Homes
- 26 Flagg St
- 52 Pleasant St
- 21 Franklin St
- 17 Wright St
- 11 Hovey St
- 18 Beacon St Unit 18
- 37 1/2 Chestnut St
- 31 Arlington Rd Unit 1-6
- 27 Arlington Rd Unit 1-6
- 477 Main St
- 29 Arlington Rd Unit 4
- 7 Prospect St
- 14 Church Ave
- 14 Church Ave Unit 2
- 15 Sturgis St
- 166 Place Ln Unit 166
- 168 Place Ln
- 602 Main St Unit 1
- 9 Wade Ave
- 35 Prospect St Unit 215
- 44 N Warren St
- 7 Grove St
- 7 Grove St Unit 2
- 9 Grove St Unit 2
- 9 Grove St Unit 1
- 9 Grove St Unit B - 9
- 9 Grove St Unit B
- 9 Grove St Unit A
- 61 N Warren St
- 11 Grove St
- 59 N Warren St
- 41 Harrison Ave Unit 41
- 41 Harrison Ave Unit 1
- 39 Harrison Ave
- 45 Harrison Ave
- 15 Grove St
- 35 Harrison Ave
- 63 N Warren St
- 8 Grove St
- 4 Grove St