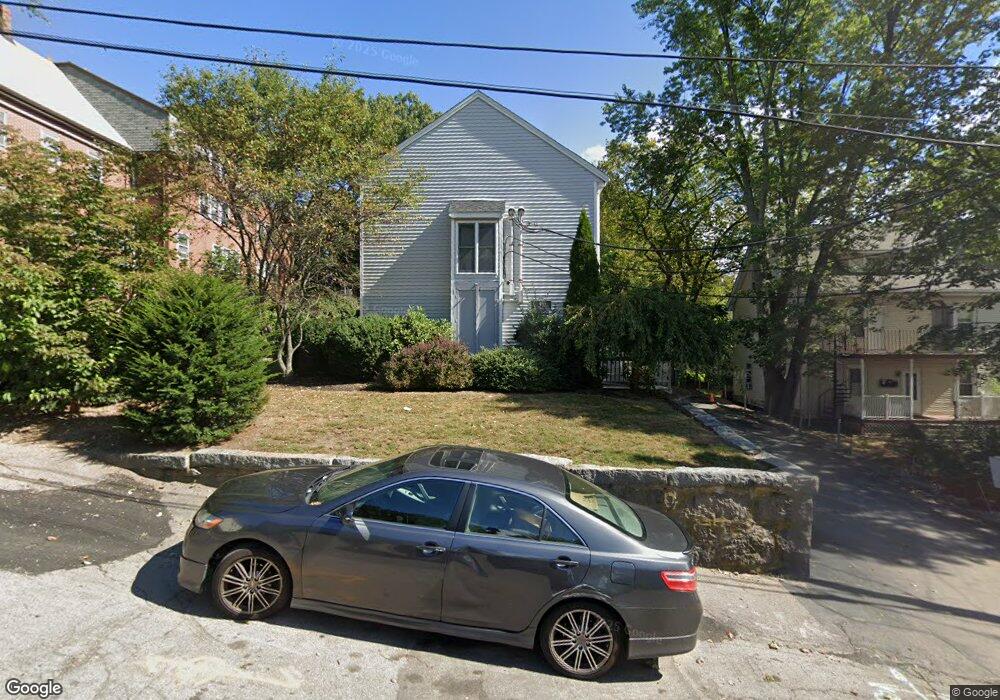
46 Nelson St Unit F Quincy, MA 02169
South Quincy NeighborhoodEstimated Value: $428,346 - $498,000
2
Beds
2
Baths
940
Sq Ft
$493/Sq Ft
Est. Value
About This Home
This home is located at 46 Nelson St Unit F, Quincy, MA 02169 and is currently estimated at $463,087, approximately $492 per square foot. 46 Nelson St Unit F is a home located in Norfolk County with nearby schools including South West Middle School, Lincoln-Hancock Community School, and Quincy High School.
Ownership History
Date
Name
Owned For
Owner Type
Purchase Details
Closed on
May 29, 2014
Sold by
Chan Nathaniel
Bought by
Anc Properties Llc
Current Estimated Value
Purchase Details
Closed on
Jul 17, 2003
Sold by
Lam Ming C
Bought by
Chan Nathaniel
Home Financials for this Owner
Home Financials are based on the most recent Mortgage that was taken out on this home.
Original Mortgage
$233,460
Interest Rate
5.34%
Mortgage Type
Purchase Money Mortgage
Create a Home Valuation Report for This Property
The Home Valuation Report is an in-depth analysis detailing your home's value as well as a comparison with similar homes in the area
Home Values in the Area
Average Home Value in this Area
Purchase History
| Date | Buyer | Sale Price | Title Company |
|---|---|---|---|
| Anc Properties Llc | -- | -- | |
| Chan Nathaniel | $259,400 | -- |
Source: Public Records
Mortgage History
| Date | Status | Borrower | Loan Amount |
|---|---|---|---|
| Previous Owner | Chan Nathaniel | $233,460 |
Source: Public Records
Tax History Compared to Growth
Tax History
| Year | Tax Paid | Tax Assessment Tax Assessment Total Assessment is a certain percentage of the fair market value that is determined by local assessors to be the total taxable value of land and additions on the property. | Land | Improvement |
|---|---|---|---|---|
| 2025 | $4,415 | $382,900 | $0 | $382,900 |
| 2024 | $4,121 | $365,700 | $0 | $365,700 |
| 2023 | $3,837 | $344,700 | $0 | $344,700 |
| 2022 | $3,867 | $322,800 | $0 | $322,800 |
| 2021 | $3,659 | $301,400 | $0 | $301,400 |
| 2020 | $3,557 | $286,200 | $0 | $286,200 |
| 2019 | $3,451 | $275,000 | $0 | $275,000 |
| 2018 | $3,555 | $266,500 | $0 | $266,500 |
| 2017 | $3,554 | $250,800 | $0 | $250,800 |
| 2016 | $3,418 | $238,000 | $0 | $238,000 |
| 2015 | $3,402 | $233,000 | $0 | $233,000 |
| 2014 | $3,229 | $217,300 | $0 | $217,300 |
Source: Public Records
Map
Nearby Homes
- 14 Arthur Ave
- 12 Arthur Ave
- 46-48 Buckley St
- 21 Arthur St
- 57 Buckley St
- 46 Suomi Rd
- 46 Suomi Rd Unit 46
- 91 Garfield St
- 64 Garfield St Unit B
- 42 West St
- 211 Copeland St
- 1 Cityview Ln Unit 506
- 1 Cityview Ln Unit 210
- 1 Cityview Ln Unit 709
- 1 Cityview Ln Unit 204
- 94 Brook Rd Unit 3
- 51 Brook Rd
- 76 Scotch Pond Place Unit 76
- 118 Brook Rd Unit 2
- 73 Scotch Pond Place
- 46 Nelson St Unit H
- 46 Nelson St Unit G
- 46 Nelson St Unit E
- 46 Nelson St Unit D
- 46 Nelson St Unit C
- 46 Nelson St Unit B
- 46 Nelson St Unit A
- 46 Nelson St
- 52 Nelson St
- 52 Nelson St Unit 3
- 22 Carlmark St Unit A
- 24 Carlmark St
- 22 Carlmark St Unit 2
- 22 Carlmark St Unit 22B
- 24 Carlmark St Unit 24
- 22 Carlmark St
- 24 Carlmark St Unit B
- 22A Carlmark St Unit A
- 22 Carlmark St Unit B
- 51 Arthur St