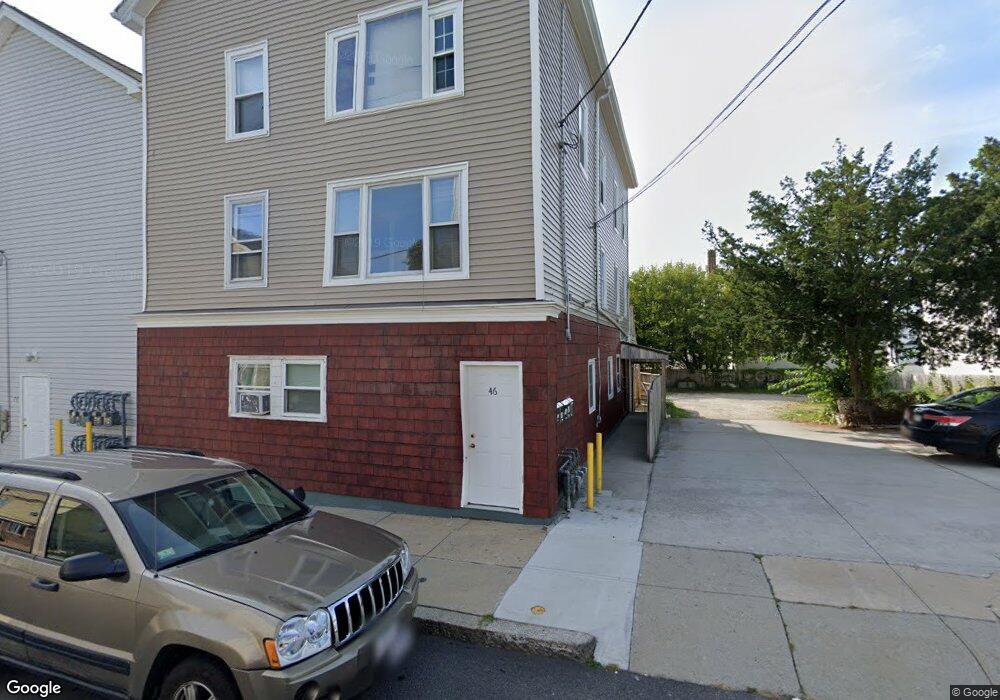
46 Orange St Unit 3 Fall River, MA 02720
Oak Grove Village NeighborhoodEstimated Value: $610,000 - $674,000
3
Beds
1
Bath
1,350
Sq Ft
$475/Sq Ft
Est. Value
About This Home
This home is located at 46 Orange St Unit 3, Fall River, MA 02720 and is currently estimated at $641,000, approximately $474 per square foot. 46 Orange St Unit 3 is a home located in Bristol County with nearby schools including Mary Fonseca Elementary School, Morton Middle School, and B M C Durfee High School.
Ownership History
Date
Name
Owned For
Owner Type
Purchase Details
Closed on
Jul 11, 2016
Sold by
Rogerio Marabuto Ret
Bought by
Mossalim Youssef
Current Estimated Value
Home Financials for this Owner
Home Financials are based on the most recent Mortgage that was taken out on this home.
Original Mortgage
$191,468
Outstanding Balance
$153,144
Interest Rate
3.64%
Mortgage Type
FHA
Estimated Equity
$487,856
Purchase Details
Closed on
Jan 15, 2016
Sold by
Marabuto Rogerio
Bought by
Rogerio Marabuto Ret
Purchase Details
Closed on
Jun 18, 2013
Sold by
James B Nutter & Co
Bought by
Federal National Mortgage Association
Purchase Details
Closed on
Dec 17, 2012
Sold by
Pacheco Adelaide
Bought by
James B Nutter & Co
Create a Home Valuation Report for This Property
The Home Valuation Report is an in-depth analysis detailing your home's value as well as a comparison with similar homes in the area
Home Values in the Area
Average Home Value in this Area
Purchase History
| Date | Buyer | Sale Price | Title Company |
|---|---|---|---|
| Mossalim Youssef | $195,000 | -- | |
| Rogerio Marabuto Ret | -- | -- | |
| Federal National Mortgage Association | -- | -- | |
| James B Nutter & Co | $98,000 | -- |
Source: Public Records
Mortgage History
| Date | Status | Borrower | Loan Amount |
|---|---|---|---|
| Open | Mossalim Youssef | $191,468 |
Source: Public Records
Tax History
| Year | Tax Paid | Tax Assessment Tax Assessment Total Assessment is a certain percentage of the fair market value that is determined by local assessors to be the total taxable value of land and additions on the property. | Land | Improvement |
|---|---|---|---|---|
| 2025 | $5,751 | $502,300 | $129,000 | $373,300 |
| 2024 | $5,496 | $478,300 | $124,100 | $354,200 |
| 2023 | $4,960 | $404,200 | $106,400 | $297,800 |
| 2022 | $4,389 | $347,800 | $96,700 | $251,100 |
| 2021 | $4,152 | $300,200 | $89,500 | $210,700 |
| 2020 | $3,732 | $258,300 | $85,600 | $172,700 |
| 2019 | $3,200 | $219,500 | $81,600 | $137,900 |
| 2018 | $2,937 | $200,900 | $80,000 | $120,900 |
| 2017 | $2,836 | $202,600 | $81,700 | $120,900 |
| 2016 | $2,768 | $203,100 | $85,100 | $118,000 |
| 2015 | $2,429 | $185,700 | $81,900 | $103,800 |
| 2014 | $2,505 | $199,100 | $86,200 | $112,900 |
Source: Public Records
Map
Nearby Homes
- 120 15th St Unit 5
- 105 16th St
- 992 Pine St
- 218 Plain St
- 217 Plain St
- 243 Robeson St Unit 6
- 243 Robeson St Unit 3
- 884 Cherry St
- 273 Tremont St
- 869 Bedford St
- 511 Bank St
- 139 Quarry St
- 84 Healy St
- 464 Bank St Unit 10
- 89 Oak St
- 10 Carlisa Dr
- 104 Oak St
- 233 Franklin St
- 229 Franklin St
- 528 Cherry St Unit 3
- 46 Orange St
- 44 Orange St
- 30 Orange St
- 30 Orange St Unit 1
- 20 Orange St
- 41 Tremont St
- 41 Tremont St Unit 1
- 41 Tremont St Unit 2
- 60 Orange St
- 60 Orange St Unit 3
- 60 Orange St Unit 2
- 60 Orange St Unit 1
- 60 Orange St Unit C
- 60 Orange St Unit A
- 60 Orange St Unit B
- 41 Orange St Unit 3
- 41 Orange St
- 31 Orange St
- 57 Orange St
- 39 Tremont St
Your Personal Tour Guide
Ask me questions while you tour the home.