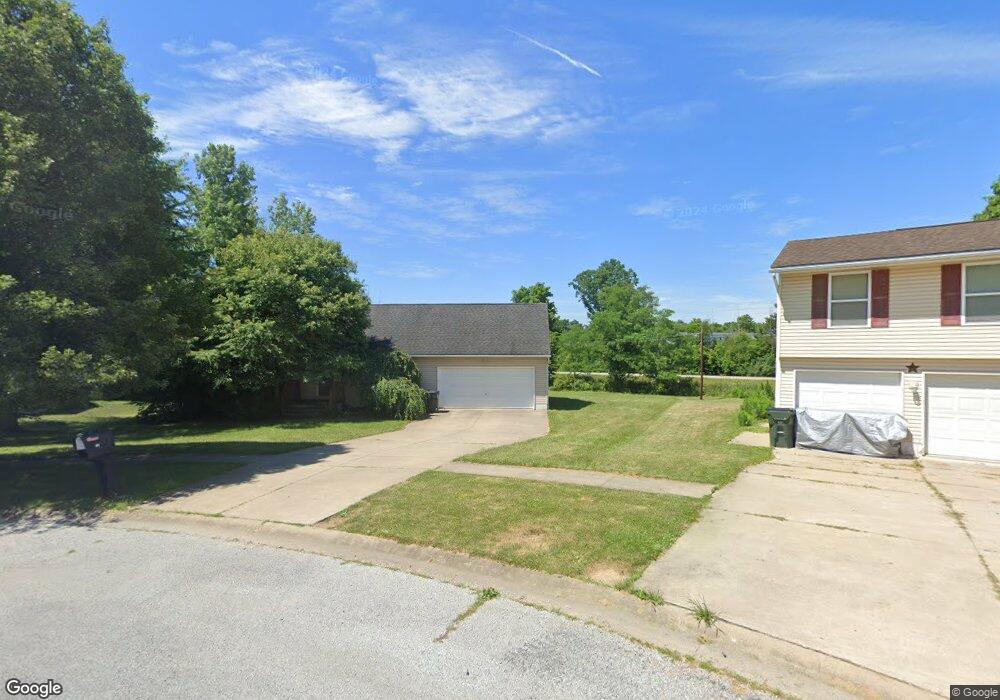
46 Par Ave West Salem, OH 44287
Estimated Value: $210,000 - $253,000
3
Beds
3
Baths
1,232
Sq Ft
$191/Sq Ft
Est. Value
About This Home
This home is located at 46 Par Ave, West Salem, OH 44287 and is currently estimated at $235,334, approximately $191 per square foot. 46 Par Ave is a home located in Wayne County with nearby schools including Northwestern Elementary School, Northwestern Middle School, and Northwestern High School.
Ownership History
Date
Name
Owned For
Owner Type
Purchase Details
Closed on
Jan 14, 2009
Sold by
Household Realty Corporation
Bought by
Jones Jeffrey L
Current Estimated Value
Home Financials for this Owner
Home Financials are based on the most recent Mortgage that was taken out on this home.
Original Mortgage
$114,400
Outstanding Balance
$73,651
Interest Rate
5.53%
Mortgage Type
VA
Estimated Equity
$161,683
Purchase Details
Closed on
Aug 26, 2003
Sold by
Highpoint Golfing Community Inc
Bought by
Goldie Robert and Goldie Nancy
Home Financials for this Owner
Home Financials are based on the most recent Mortgage that was taken out on this home.
Original Mortgage
$134,400
Interest Rate
7.37%
Mortgage Type
Purchase Money Mortgage
Create a Home Valuation Report for This Property
The Home Valuation Report is an in-depth analysis detailing your home's value as well as a comparison with similar homes in the area
Home Values in the Area
Average Home Value in this Area
Purchase History
| Date | Buyer | Sale Price | Title Company |
|---|---|---|---|
| Jones Jeffrey L | $224 | Secured Lending Services | |
| Household Realty | $93,334 | Secured Lending Services | |
| Goldie Robert | $134,650 | Title First Agency | |
| Highpoint Golfing Community Inc | -- | Title First Agency |
Source: Public Records
Mortgage History
| Date | Status | Borrower | Loan Amount |
|---|---|---|---|
| Open | Household Realty | $114,400 | |
| Closed | Household Realty | $114,400 | |
| Previous Owner | Goldie Robert | $134,400 |
Source: Public Records
Tax History Compared to Growth
Tax History
| Year | Tax Paid | Tax Assessment Tax Assessment Total Assessment is a certain percentage of the fair market value that is determined by local assessors to be the total taxable value of land and additions on the property. | Land | Improvement |
|---|---|---|---|---|
| 2024 | $2,777 | $69,460 | $17,860 | $51,600 |
| 2023 | $2,777 | $69,460 | $17,860 | $51,600 |
| 2022 | $2,475 | $56,020 | $14,410 | $41,610 |
| 2021 | $2,409 | $56,020 | $14,410 | $41,610 |
| 2020 | $2,435 | $56,020 | $14,410 | $41,610 |
| 2019 | $2,271 | $48,790 | $9,820 | $38,970 |
| 2018 | $2,233 | $48,790 | $9,820 | $38,970 |
| 2017 | $2,013 | $48,790 | $9,820 | $38,970 |
| 2016 | $2,008 | $46,910 | $9,440 | $37,470 |
| 2015 | $1,908 | $46,910 | $9,440 | $37,470 |
| 2014 | $1,930 | $46,910 | $9,440 | $37,470 |
| 2013 | $1,780 | $42,080 | $7,930 | $34,150 |
Source: Public Records
Map
Nearby Homes
- 13368 Flemming Rd
- 113 Flemming Rd
- 64 N Main St
- 0 Congress Unit 5159386
- 0 Congress Unit 229574
- 0 Congress Unit 5150334
- 12516 Congress Rd
- 58 State Route 42
- 0 Township Road 810
- 7104 Ruff Rd
- 0 Jeffrey Rd Unit LotWP001
- 0 Jeffrey Rd
- 9653 N Elyria Rd
- 107 County Road 500
- 11282 Stratton Rd
- 566 County Road 175
- 568 County Road 175
- 2199 Brassica Ln
- 76 County Road 1100
- 9835 Congress Rd
- 52 Par Ave
- 40 Par Ave
- 34 Par Ave
- 32 Par Ave
- 51 Par Ave
- 26 Par Ave
- 45 Par Ave
- 39 Par Ave
- 20 Par Ave
- 33 Par Ave
- 25 Par Ave
- 17 Par Ave
- 6 High Point Dr
- 10 Par Ave
- 9 Par Ave
- 0 High Point Dr Unit 4040795
- 0 High Point Dr Unit 4040789
- 0 Birdie Dr Unit 3940636
- 0 High Point Dr Unit 3940634
- 0 High Point Dr Unit 3940630