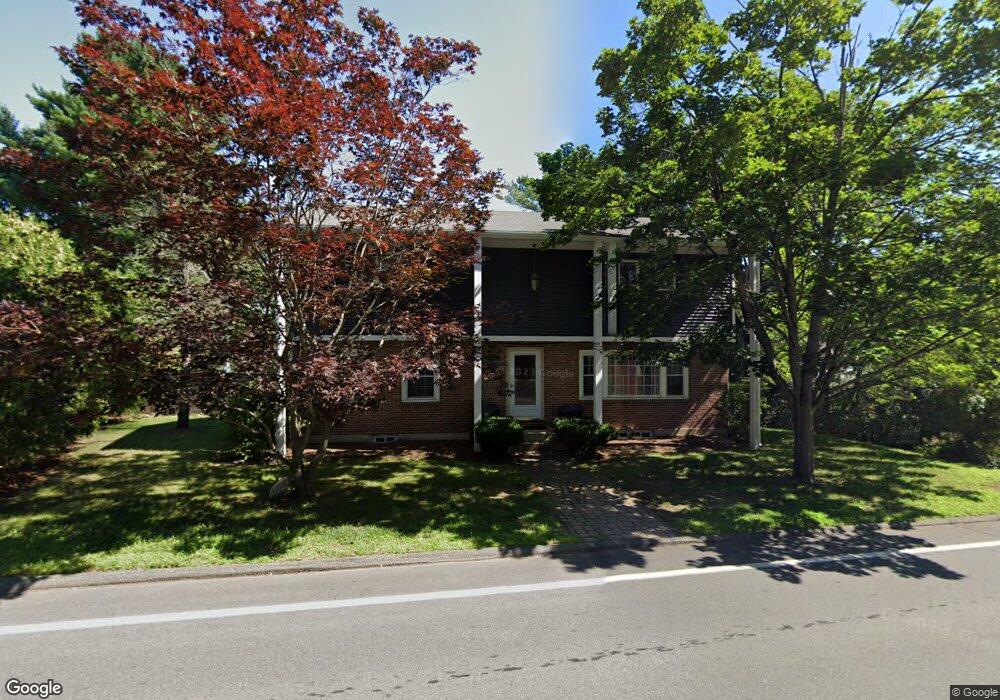
46 Park St Wilmington, MA 01887
Estimated Value: $770,896 - $873,000
3
Beds
1
Bath
2,058
Sq Ft
$402/Sq Ft
Est. Value
About This Home
This home is located at 46 Park St, Wilmington, MA 01887 and is currently estimated at $827,474, approximately $402 per square foot. 46 Park St is a home located in Middlesex County with nearby schools including Wilmington Middle School, Wilmington High School, and N Reading Knowledge Beginnings.
Ownership History
Date
Name
Owned For
Owner Type
Purchase Details
Closed on
Nov 1, 2000
Sold by
Cormier Joseph F and Cormier Nancy G
Bought by
Luongo Lynne C and Luongo Ralph M
Current Estimated Value
Home Financials for this Owner
Home Financials are based on the most recent Mortgage that was taken out on this home.
Original Mortgage
$150,000
Interest Rate
7.83%
Mortgage Type
Purchase Money Mortgage
Create a Home Valuation Report for This Property
The Home Valuation Report is an in-depth analysis detailing your home's value as well as a comparison with similar homes in the area
Home Values in the Area
Average Home Value in this Area
Purchase History
| Date | Buyer | Sale Price | Title Company |
|---|---|---|---|
| Luongo Lynne C | $294,900 | -- |
Source: Public Records
Mortgage History
| Date | Status | Borrower | Loan Amount |
|---|---|---|---|
| Open | Luongo Lynne C | $149,000 | |
| Closed | Luongo Lynne C | $150,000 |
Source: Public Records
Tax History Compared to Growth
Tax History
| Year | Tax Paid | Tax Assessment Tax Assessment Total Assessment is a certain percentage of the fair market value that is determined by local assessors to be the total taxable value of land and additions on the property. | Land | Improvement |
|---|---|---|---|---|
| 2025 | $7,669 | $669,800 | $311,300 | $358,500 |
| 2024 | $7,532 | $659,000 | $311,300 | $347,700 |
| 2023 | $7,048 | $590,300 | $283,000 | $307,300 |
| 2022 | $6,613 | $507,500 | $235,900 | $271,600 |
| 2021 | $6,559 | $473,900 | $214,300 | $259,600 |
| 2020 | $6,351 | $467,700 | $214,300 | $253,400 |
| 2019 | $6,186 | $449,900 | $204,000 | $245,900 |
| 2018 | $6,082 | $422,100 | $194,200 | $227,900 |
| 2017 | $6,027 | $417,100 | $194,200 | $222,900 |
| 2016 | $5,646 | $385,900 | $184,900 | $201,000 |
| 2015 | $5,449 | $379,200 | $184,900 | $194,300 |
| 2014 | $5,152 | $361,800 | $176,000 | $185,800 |
Source: Public Records
Map
Nearby Homes
- 3 Gordon Rd
- 12 Lockwood Rd
- 220 Martins Landing Unit 309
- 260 Martins Landing Unit 508
- 260 Martins Landing Unit 103
- 200 Martins Landing Unit 102
- 5 Flynn Way
- 300 Martins Landing Unit 107
- 3 Oakdale Rd
- 320 Martins Landing Unit 311
- 320 Martins Landing Unit 108
- 320 Martins Landing Unit 109
- 320 Martins Landing Unit 110
- 320 Martins Landing Unit 303
- 320 Martins Landing Unit 102
- 320 Martins Landing Unit 103
- 320 Martins Landing Unit 403
- 320 Martins Landing Unit 210
- 320 Martins Landing Unit 2201
- 320 Martins Landing Unit 112