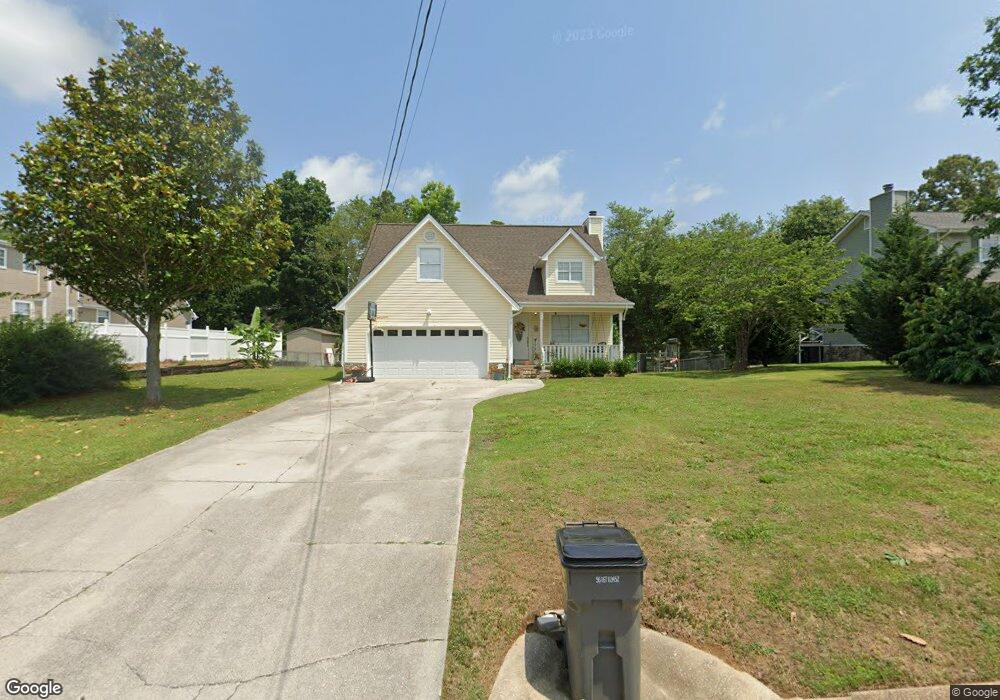
46 Pebblestone Dr Ringgold, GA 30736
Estimated Value: $285,782 - $340,000
3
Beds
2
Baths
1,520
Sq Ft
$200/Sq Ft
Est. Value
About This Home
This home is located at 46 Pebblestone Dr, Ringgold, GA 30736 and is currently estimated at $304,196, approximately $200 per square foot. 46 Pebblestone Dr is a home located in Catoosa County with nearby schools including Ringgold Primary School, Ringgold Elementary School, and Heritage Middle School.
Ownership History
Date
Name
Owned For
Owner Type
Purchase Details
Closed on
Jul 27, 2020
Sold by
Derryberry Jonathan W
Bought by
Derryberry Jessica Leeanne and Pigman Martha C
Current Estimated Value
Home Financials for this Owner
Home Financials are based on the most recent Mortgage that was taken out on this home.
Original Mortgage
$146,520
Outstanding Balance
$128,760
Interest Rate
3.1%
Mortgage Type
FHA
Estimated Equity
$175,436
Purchase Details
Closed on
Oct 28, 2016
Sold by
Estat Charles Ellis
Bought by
Derryberry Jonathan W and Swinney Jessica L
Home Financials for this Owner
Home Financials are based on the most recent Mortgage that was taken out on this home.
Original Mortgage
$147,283
Interest Rate
3.25%
Mortgage Type
FHA
Purchase Details
Closed on
May 19, 1998
Sold by
Turner Carolyn F
Bought by
Turner Carolyn And
Purchase Details
Closed on
May 18, 1995
Bought by
Turner Carolyn F
Create a Home Valuation Report for This Property
The Home Valuation Report is an in-depth analysis detailing your home's value as well as a comparison with similar homes in the area
Home Values in the Area
Average Home Value in this Area
Purchase History
| Date | Buyer | Sale Price | Title Company |
|---|---|---|---|
| Derryberry Jessica Leeanne | -- | -- | |
| Derryberry Jonathan W | $150,000 | -- | |
| Turner Carolyn And | -- | -- | |
| Turner Carolyn F | $92,000 | -- |
Source: Public Records
Mortgage History
| Date | Status | Borrower | Loan Amount |
|---|---|---|---|
| Open | Derryberry Jessica Leeanne | $146,520 | |
| Previous Owner | Derryberry Jonathan W | $147,283 |
Source: Public Records
Tax History
| Year | Tax Paid | Tax Assessment Tax Assessment Total Assessment is a certain percentage of the fair market value that is determined by local assessors to be the total taxable value of land and additions on the property. | Land | Improvement |
|---|---|---|---|---|
| 2025 | $2,153 | $113,415 | $14,000 | $99,415 |
| 2024 | $2,330 | $109,241 | $14,000 | $95,241 |
| 2023 | $1,866 | $83,365 | $12,000 | $71,365 |
| 2022 | $1,516 | $67,723 | $12,000 | $55,723 |
| 2021 | $1,417 | $67,723 | $12,000 | $55,723 |
| 2020 | $1,395 | $60,266 | $12,000 | $48,266 |
| 2019 | $1,382 | $59,066 | $10,800 | $48,266 |
| 2018 | $1,459 | $59,066 | $10,800 | $48,266 |
| 2017 | $1,440 | $58,289 | $10,800 | $47,489 |
| 2016 | $1,330 | $51,168 | $10,800 | $40,368 |
| 2015 | -- | $51,168 | $10,800 | $40,368 |
| 2014 | -- | $49,516 | $9,600 | $39,916 |
| 2013 | -- | $49,515 | $9,600 | $39,915 |
Source: Public Records
Map
Nearby Homes
- 56 Ginger Dr
- 156 Bent Tree Dr
- 478 Dedmon Rd
- 555 Dedmon Rd
- 81 Shrader Ln
- 486 E Sharon Cir
- 63 Sunset Dr
- 506 Crestview Cir
- 8 E Sharon Cir
- 151 Peachtree Cir
- 184 Peachtree Cir
- 3 Cove Rd
- 391 Oak Tree Rd
- 141 Harbour Ln
- 158 Smoketree Cir
- 25 Golden Pond Ln
- 2578 Poplar Springs Rd
- 0 Battlefield Pkwy Unit 1521890
- 405 Chambers Ln
- 516 Hill St
- 26 Pebblestone Dr
- 43 Pebblestone Dr
- 336 Stonecrest Cir Unit 3
- 336 Stonecrest Cir
- 316 Stonecrest Cir
- 316 Stonecrest Cir Unit 3
- 354 Stonecrest Cir
- 37 Pebblestone Dr
- 14 Pebblestone Dr
- 57 Pebblestone Dr Unit 4
- 57 Pebblestone Dr
- 75 Pebblestone Dr
- 374 Stonecrest Cir Unit 3
- 374 Stonecrest Cir
- 98 Pebblestone Dr
- 282 Stonecrest Cir
- 95 Pebblestone Dr
- 8 Pebblestone Dr Unit 4
- 8 Pebblestone Dr
- 388 Stonecrest Cir