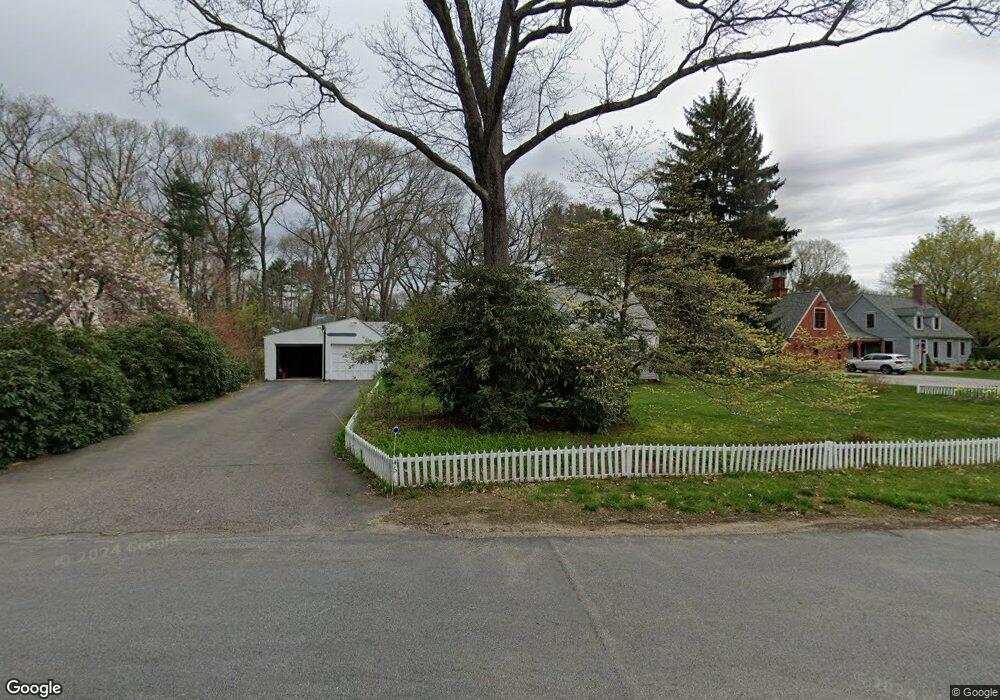
46 Plain Rd Wayland, MA 01778
Estimated Value: $982,000 - $1,191,000
4
Beds
2
Baths
2,212
Sq Ft
$484/Sq Ft
Est. Value
About This Home
This home is located at 46 Plain Rd, Wayland, MA 01778 and is currently estimated at $1,071,327, approximately $484 per square foot. 46 Plain Rd is a home located in Middlesex County with nearby schools including Wayland High School and Veritas Christian Academy.
Ownership History
Date
Name
Owned For
Owner Type
Purchase Details
Closed on
Jun 28, 2001
Sold by
Maguire Ann W and Maguire Robert F
Bought by
Cambridge Trust Co
Current Estimated Value
Create a Home Valuation Report for This Property
The Home Valuation Report is an in-depth analysis detailing your home's value as well as a comparison with similar homes in the area
Home Values in the Area
Average Home Value in this Area
Purchase History
| Date | Buyer | Sale Price | Title Company |
|---|---|---|---|
| Cambridge Trust Co | $150,000 | -- |
Source: Public Records
Mortgage History
| Date | Status | Borrower | Loan Amount |
|---|---|---|---|
| Previous Owner | Cambridge Trust Co | $258,000 | |
| Previous Owner | Cambridge Trust Co | $80,000 |
Source: Public Records
Tax History
| Year | Tax Paid | Tax Assessment Tax Assessment Total Assessment is a certain percentage of the fair market value that is determined by local assessors to be the total taxable value of land and additions on the property. | Land | Improvement |
|---|---|---|---|---|
| 2025 | $14,206 | $908,900 | $550,100 | $358,800 |
| 2024 | $13,429 | $865,300 | $523,800 | $341,500 |
| 2023 | $13,037 | $783,000 | $476,200 | $306,800 |
| 2022 | $12,293 | $669,900 | $394,400 | $275,500 |
| 2021 | $4,246 | $634,000 | $358,500 | $275,500 |
| 2020 | $4,257 | $631,400 | $358,500 | $272,900 |
| 2019 | $11,136 | $609,200 | $341,400 | $267,800 |
| 2018 | $3,832 | $567,200 | $326,300 | $240,900 |
| 2017 | $10,044 | $553,700 | $316,500 | $237,200 |
| 2016 | $9,142 | $527,200 | $310,200 | $217,000 |
| 2015 | $9,458 | $514,300 | $310,200 | $204,100 |
Source: Public Records
Map
Nearby Homes
- 63 Claypit Hill Rd
- 20 Lee Rd
- 156 Boston Post Rd
- 2 Old Sudbury Rd
- 21 Decatur Ln
- 37 Orchard Ln
- 13 Rich Valley Rd
- 17 Glezen Ln
- 6 Dairy Farm Ln
- 127 Glezen Ln
- 101 Draper Rd
- 233 Rice Rd
- 32 Highland Cir
- 823 Boston Post Rd
- 4 Peartree Ln
- 23 Covered Bridge Ln
- 20 Hickory Hill Rd
- 21 Westerly Rd
- 15 Claridge Dr
- 9 Sanderson Ln
Your Personal Tour Guide
Ask me questions while you tour the home.