46 Plain St Rehoboth, MA 02769
Estimated Value: $640,302 - $749,000
3
Beds
2
Baths
2,146
Sq Ft
$325/Sq Ft
Est. Value
About This Home
This home is located at 46 Plain St, Rehoboth, MA 02769 and is currently estimated at $697,826, approximately $325 per square foot. 46 Plain St is a home located in Bristol County with nearby schools including Dighton-Rehoboth Regional High School and Cedar Brook School.
Ownership History
Date
Name
Owned For
Owner Type
Purchase Details
Closed on
Dec 2, 1998
Sold by
Courchesne Michael J and Courchesne Candy S
Bought by
Obrien William T and Obrien Jill P
Current Estimated Value
Home Financials for this Owner
Home Financials are based on the most recent Mortgage that was taken out on this home.
Original Mortgage
$160,000
Outstanding Balance
$36,030
Interest Rate
6.68%
Mortgage Type
Purchase Money Mortgage
Estimated Equity
$661,796
Create a Home Valuation Report for This Property
The Home Valuation Report is an in-depth analysis detailing your home's value as well as a comparison with similar homes in the area
Home Values in the Area
Average Home Value in this Area
Purchase History
| Date | Buyer | Sale Price | Title Company |
|---|---|---|---|
| Obrien William T | $200,000 | -- |
Source: Public Records
Mortgage History
| Date | Status | Borrower | Loan Amount |
|---|---|---|---|
| Open | Obrien William T | $50,000 | |
| Closed | Obrien William T | $12,000 | |
| Open | Obrien William T | $160,000 |
Source: Public Records
Tax History
| Year | Tax Paid | Tax Assessment Tax Assessment Total Assessment is a certain percentage of the fair market value that is determined by local assessors to be the total taxable value of land and additions on the property. | Land | Improvement |
|---|---|---|---|---|
| 2025 | $57 | $513,200 | $193,200 | $320,000 |
| 2024 | $5,600 | $493,000 | $193,200 | $299,800 |
| 2023 | $5,439 | $471,500 | $189,600 | $281,900 |
| 2022 | $5,439 | $429,300 | $189,600 | $239,700 |
| 2021 | $5,281 | $398,900 | $181,800 | $217,100 |
| 2020 | $5,026 | $383,100 | $181,800 | $201,300 |
| 2018 | $4,462 | $372,800 | $174,000 | $198,800 |
| 2017 | $4,165 | $331,600 | $174,000 | $157,600 |
| 2016 | $4,085 | $336,200 | $174,000 | $162,200 |
| 2015 | $3,777 | $306,800 | $166,800 | $140,000 |
| 2014 | $3,727 | $299,600 | $159,600 | $140,000 |
Source: Public Records
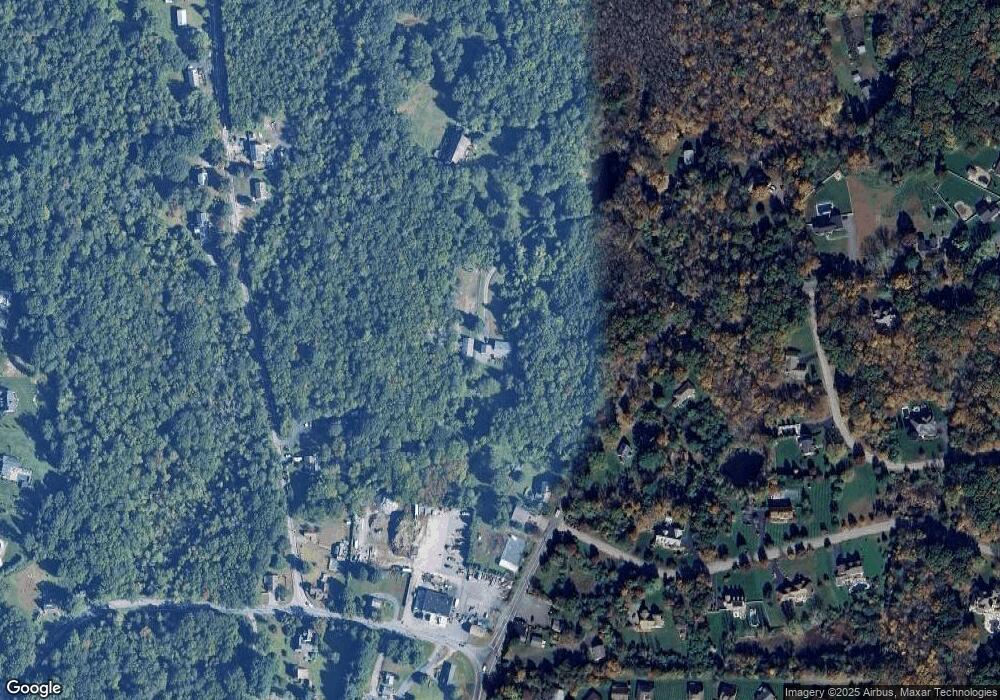
Map
Nearby Homes
- 0 Plain St
- 0 Plain St Unit 751968
- 0 Plain St Unit 313804
- 0 Plain St Unit 7100
- 0 Plain St Unit 911492
- 0 Plain St Unit 702797
- 0 Plain St Unit 73332800
- 52 Plain St
- 47 Plain St
- 43 Plain St
- 151 Plain St
- 42 Plain St
- 8 Brook St
- 223 Moulton St
- 75 Mikayla Ann Dr
- 61 Plain St
- 38 Plain St
- 2 Brook St
- 2 Brook St
- 2 Brook St