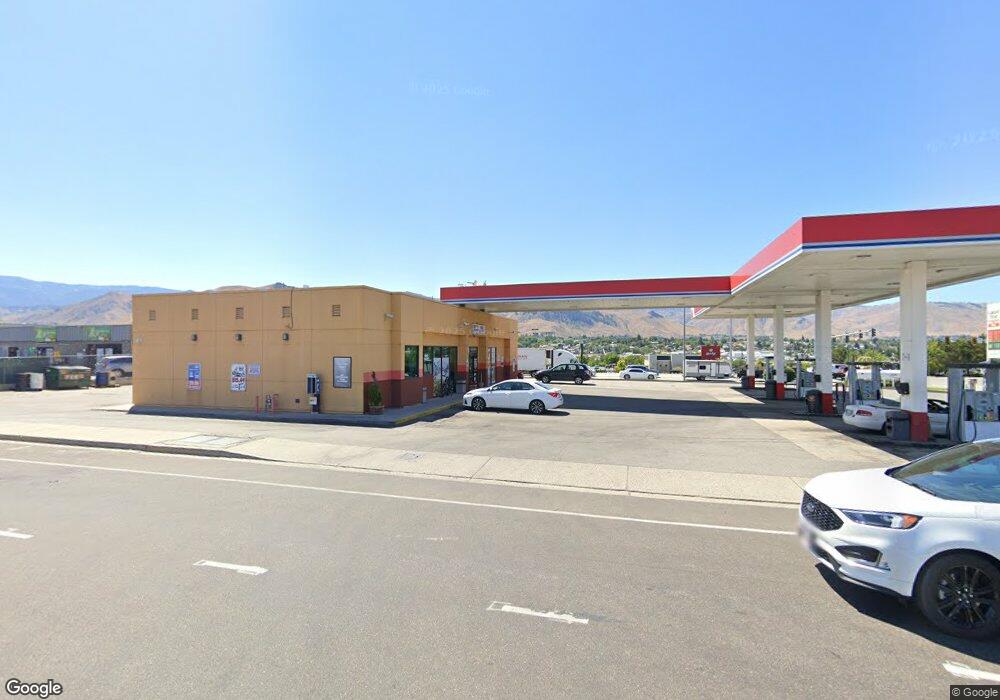
46 Rock Island Rd East Wenatchee, WA 98802
Estimated Value: $846,780
--
Bed
--
Bath
2,350
Sq Ft
$360/Sq Ft
Est. Value
About This Home
This home is located at 46 Rock Island Rd, East Wenatchee, WA 98802 and is currently estimated at $846,780, approximately $360 per square foot. 46 Rock Island Rd is a home located in Douglas County with nearby schools including Grant Elementary School, Clovis Point Intermediate School, and Eastmont Junior High School.
Ownership History
Date
Name
Owned For
Owner Type
Purchase Details
Closed on
May 4, 2023
Sold by
Homesley Properties Llc
Bought by
Ocean Blue Investments Llc
Current Estimated Value
Home Financials for this Owner
Home Financials are based on the most recent Mortgage that was taken out on this home.
Original Mortgage
$585,000
Outstanding Balance
$568,405
Interest Rate
6.28%
Mortgage Type
New Conventional
Estimated Equity
$278,375
Purchase Details
Closed on
Jan 20, 2016
Sold by
Westman Aric J
Bought by
Homesley Properties Llc
Home Financials for this Owner
Home Financials are based on the most recent Mortgage that was taken out on this home.
Original Mortgage
$288,750
Interest Rate
3.92%
Mortgage Type
Commercial
Purchase Details
Closed on
Aug 25, 2009
Sold by
Sapp Harmon D
Bought by
Westman Aric J
Home Financials for this Owner
Home Financials are based on the most recent Mortgage that was taken out on this home.
Original Mortgage
$295,700
Interest Rate
5.09%
Mortgage Type
Commercial
Create a Home Valuation Report for This Property
The Home Valuation Report is an in-depth analysis detailing your home's value as well as a comparison with similar homes in the area
Home Values in the Area
Average Home Value in this Area
Purchase History
| Date | Buyer | Sale Price | Title Company |
|---|---|---|---|
| Ocean Blue Investments Llc | $780,000 | Fig Title Llc | |
| Homesley Properties Llc | $447,908 | First American Title Ins Co | |
| Westman Aric J | $83,764 | First American Title Ins Co |
Source: Public Records
Mortgage History
| Date | Status | Borrower | Loan Amount |
|---|---|---|---|
| Open | Ocean Blue Investments Llc | $585,000 | |
| Previous Owner | Homesley Properties Llc | $288,750 | |
| Previous Owner | Westman Aric J | $295,700 |
Source: Public Records
Tax History Compared to Growth
Tax History
| Year | Tax Paid | Tax Assessment Tax Assessment Total Assessment is a certain percentage of the fair market value that is determined by local assessors to be the total taxable value of land and additions on the property. | Land | Improvement |
|---|---|---|---|---|
| 2025 | $4,322 | $510,500 | $92,000 | $418,500 |
| 2024 | $4,322 | $506,200 | $92,000 | $414,200 |
| 2023 | $4,652 | $474,300 | $92,000 | $382,300 |
| 2022 | $4,195 | $395,300 | $76,700 | $318,600 |
| 2021 | $4,545 | $395,300 | $76,700 | $318,600 |
| 2020 | $4,295 | $395,300 | $76,700 | $318,600 |
| 2018 | $4,246 | $362,600 | $55,800 | $306,800 |
| 2017 | $3,646 | $362,600 | $55,800 | $306,800 |
| 2016 | $2,488 | $337,100 | $55,800 | $281,300 |
| 2015 | $2,856 | $223,000 | $55,800 | $167,200 |
| 2014 | -- | $245,400 | $55,800 | $189,600 |
| 2013 | -- | $245,400 | $55,800 | $189,600 |
Source: Public Records
Map
Nearby Homes
- 100 Simon St SE Unit 40
- 211 S Pace Dr Unit 30
- 38 S Viewdale St
- 544 N Colorado Ave
- 203 Marr St
- 1770 Marker St
- 1704 Frances Ct
- 1535 Historic Ln
- 1201 Monitor St
- 101 N Hanford Ave
- 845 N Devon Ave
- 251 Rimrock Way
- 646 N Gale Place
- 281 Terminal Ave
- 1102 Carolyn St
- 430 Crawford Ave
- 810 Cashmere St
- 755 S Chelan Ave
- 1046 Corum Cir
- 1051 N Baker Ave Unit A-202
- 44 Rock Island Rd
- 44 Rock Island Rd
- 2195 NE Kaden Ln
- 50 Rock Island Rd
- 181 1st St SE
- 30 Rock Island Rd
- 30 Rock Island Rd
- 3053 1st St SE
- 110 Riverview Rd S
- 187 1st St SE
- 195 1st St SE
- 180 1st St SE
- 100 Simon St SE
- 100 Simon St SE Unit 39
- 100 Simon St SE Unit 38
- 100 Simon St SE Unit 37
- 100 Simon St SE Unit 36
- 100 Simon St SE Unit 35
- 100 Simon St SE Unit 34
- 100 Simon St SE Unit 33