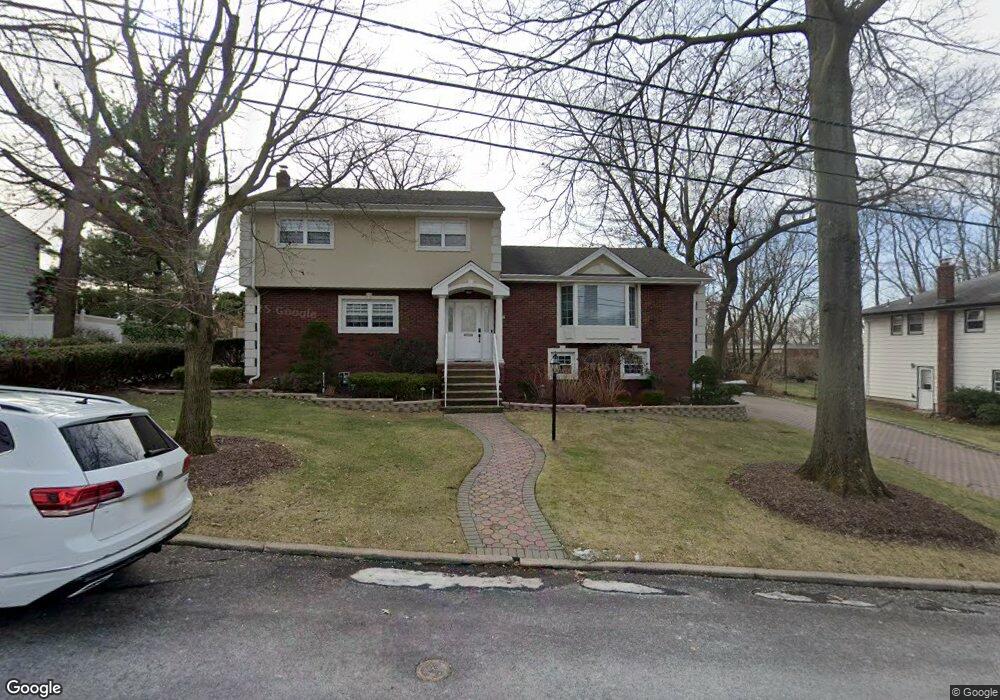
46 Rock Rd Englewood Cliffs, NJ 07632
Estimated Value: $1,282,038 - $1,484,000
--
Bed
--
Bath
2,304
Sq Ft
$603/Sq Ft
Est. Value
About This Home
This home is located at 46 Rock Rd, Englewood Cliffs, NJ 07632 and is currently estimated at $1,388,510, approximately $602 per square foot. 46 Rock Rd is a home located in Bergen County with nearby schools including North Cliff Elementary School, Upper School Elementary School, and Dwight-Englewood School.
Ownership History
Date
Name
Owned For
Owner Type
Purchase Details
Closed on
Jul 9, 2019
Sold by
Mok Edward and Mok Inja
Bought by
Mok Inja
Current Estimated Value
Purchase Details
Closed on
Dec 21, 2000
Sold by
Li Howard
Bought by
Moki Inja
Home Financials for this Owner
Home Financials are based on the most recent Mortgage that was taken out on this home.
Original Mortgage
$493,750
Interest Rate
7.64%
Create a Home Valuation Report for This Property
The Home Valuation Report is an in-depth analysis detailing your home's value as well as a comparison with similar homes in the area
Home Values in the Area
Average Home Value in this Area
Purchase History
| Date | Buyer | Sale Price | Title Company |
|---|---|---|---|
| Mok Inja | -- | -- | |
| Moki Inja | $505,000 | -- |
Source: Public Records
Mortgage History
| Date | Status | Borrower | Loan Amount |
|---|---|---|---|
| Previous Owner | Moki Inja | $493,750 |
Source: Public Records
Tax History Compared to Growth
Tax History
| Year | Tax Paid | Tax Assessment Tax Assessment Total Assessment is a certain percentage of the fair market value that is determined by local assessors to be the total taxable value of land and additions on the property. | Land | Improvement |
|---|---|---|---|---|
| 2025 | $10,127 | $876,800 | $655,500 | $221,300 |
| 2024 | $10,004 | $876,800 | $655,500 | $221,300 |
| 2023 | $9,846 | $876,800 | $655,500 | $221,300 |
| 2022 | $9,846 | $876,800 | $655,500 | $221,300 |
| 2021 | $7,569 | $876,800 | $655,500 | $221,300 |
| 2020 | $10,092 | $876,800 | $655,500 | $221,300 |
| 2019 | $9,478 | $876,800 | $655,500 | $221,300 |
| 2018 | $9,145 | $876,800 | $655,500 | $221,300 |
| 2017 | $8,750 | $876,800 | $655,500 | $221,300 |
| 2016 | $8,584 | $876,800 | $655,500 | $221,300 |
| 2015 | $8,154 | $876,800 | $655,500 | $221,300 |
| 2014 | $7,628 | $876,800 | $655,500 | $221,300 |
Source: Public Records
Map
Nearby Homes
- 316 Bolz St
- 312 Bolz St
- 26 Sara Hill Ln
- 12 Kira Ln
- 184 Jenkins Dr
- 519 E Palisade Ave
- 66 Elm St
- 51 Anderson Ave
- 45 Marjorie Terrace
- 48 S Woodland St
- 148 Demarest Ave
- 54 Van Nostrand Ave
- 320 Mountain Rd
- 577 Floyd St
- 12 Summit St
- 306 Hutchinson Rd
- 292 Maple St
- 285 Maple St
- 505 Adele Ct
- 267 E Linden Ave