Estimated Value: $571,485 - $687,000
Studio
--
Bath
1,532
Sq Ft
$416/Sq Ft
Est. Value
About This Home
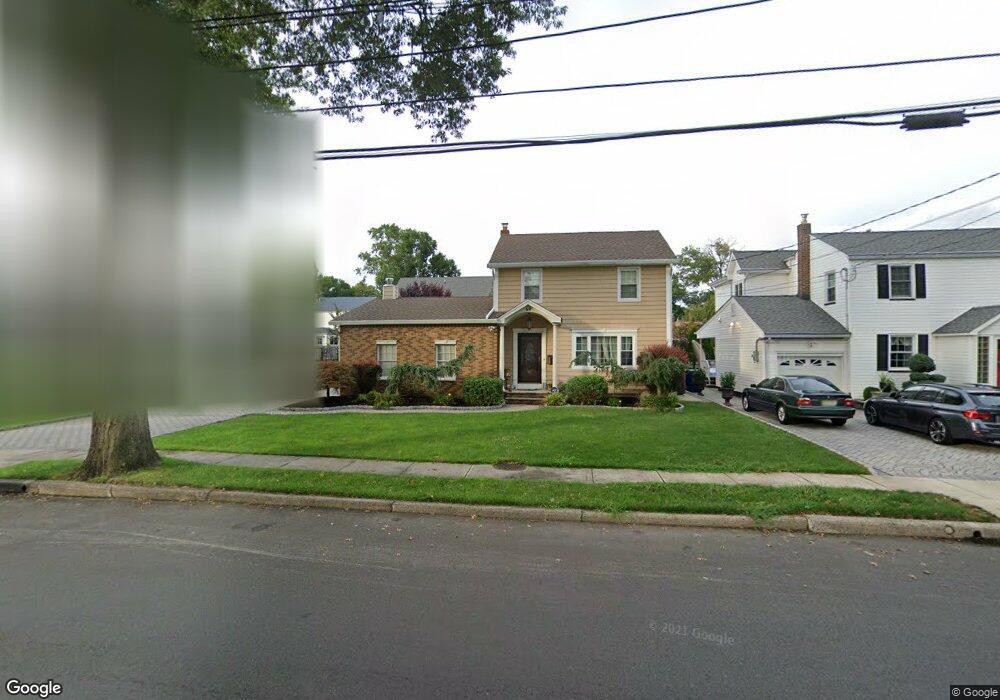
This home is located at 46 Ross St, Clark, NJ 07066 and is currently estimated at $637,621, approximately $416 per square foot. 46 Ross St is a home located in Union County with nearby schools including Valley Road Elementary School, Carl H. Kumpf Middle School, and Arthur L. Johnson High School.
Ownership History
Date
Name
Owned For
Owner Type
Purchase Details
Closed on
Jan 19, 2016
Sold by
Pimenta Alvim and Pimenta Sandra
Bought by
Jaszcza Marta D and Torreira Michae
Current Estimated Value
Home Financials for this Owner
Home Financials are based on the most recent Mortgage that was taken out on this home.
Original Mortgage
$386,520
Outstanding Balance
$307,609
Interest Rate
3.98%
Mortgage Type
New Conventional
Estimated Equity
$330,012
Purchase Details
Closed on
Nov 15, 2011
Sold by
Pimenta Alvim and Pimenta Barroqueiro,Sandra
Bought by
Pimenta Alvim and Pimenta Sandra
Purchase Details
Closed on
Dec 6, 1999
Sold by
Neno Judith and Rodrigues Delfim
Bought by
Pimenta Alvim and Barroqueiro Sandra
Home Financials for this Owner
Home Financials are based on the most recent Mortgage that was taken out on this home.
Original Mortgage
$150,000
Interest Rate
7.12%
Create a Home Valuation Report for This Property
The Home Valuation Report is an in-depth analysis detailing your home's value as well as a comparison with similar homes in the area
Home Values in the Area
Average Home Value in this Area
Purchase History
| Date | Buyer | Sale Price | Title Company |
|---|---|---|---|
| Jaszcza Marta D | $483,150 | -- | |
| Pimenta Alvim | -- | -- | |
| Pimenta Alvim | $215,000 | -- |
Source: Public Records
Mortgage History
| Date | Status | Borrower | Loan Amount |
|---|---|---|---|
| Open | Jaszcza Marta D | $386,520 | |
| Previous Owner | Pimenta Alvim | $150,000 |
Source: Public Records
Tax History
| Year | Tax Paid | Tax Assessment Tax Assessment Total Assessment is a certain percentage of the fair market value that is determined by local assessors to be the total taxable value of land and additions on the property. | Land | Improvement |
|---|---|---|---|---|
| 2025 | $9,516 | $429,800 | $220,500 | $209,300 |
| 2024 | $9,374 | $429,800 | $220,500 | $209,300 |
| 2023 | $9,374 | $429,800 | $220,500 | $209,300 |
| 2022 | $9,103 | $429,800 | $220,500 | $209,300 |
| 2021 | $9,788 | $110,100 | $41,000 | $69,100 |
| 2020 | $9,628 | $110,100 | $41,000 | $69,100 |
| 2019 | $9,531 | $110,100 | $41,000 | $69,100 |
| 2018 | $9,417 | $110,100 | $41,000 | $69,100 |
| 2017 | $9,266 | $110,100 | $41,000 | $69,100 |
| 2016 | $8,925 | $110,100 | $41,000 | $69,100 |
| 2015 | $8,834 | $110,100 | $41,000 | $69,100 |
| 2014 | $8,648 | $110,100 | $41,000 | $69,100 |
Source: Public Records
Map
Nearby Homes
- 1105 Georgian Dr
- 883 Stacy Place
- 1015 Georgian Dr
- 875 Rayhon Terrace
- 1190 W Saint Georges Ave Unit A 45
- 910 Apgar Terrace
- 651 Amherst Rd
- 1017 Karen Terrace
- 331 West Ln
- 601 Fairway Rd
- 2231 Winfield St
- 205 West Ln
- 651 W Lincoln Ave
- 275 Valley Rd
- 262 Valley Rd
- 1502 Sunnyfield Dr
- 1720 Dewitt Terrace
- 707 Erudo St
- 224 Swarthmore Rd
- 402 W Gibbons St
Your Personal Tour Guide
Ask me questions while you tour the home.