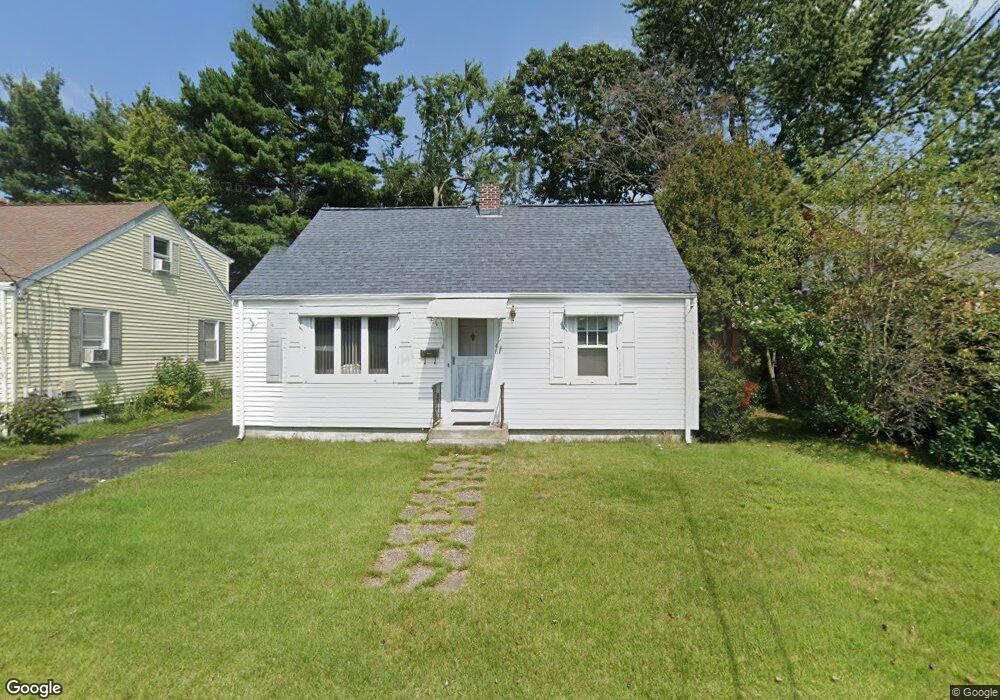
46 Rounds Ave Riverside, RI 02915
Riverside NeighborhoodEstimated Value: $338,812 - $428,000
3
Beds
1
Bath
900
Sq Ft
$424/Sq Ft
Est. Value
About This Home
This home is located at 46 Rounds Ave, Riverside, RI 02915 and is currently estimated at $381,703, approximately $424 per square foot. 46 Rounds Ave is a home located in Providence County with nearby schools including East Providence High School, St Luke Elementary School, and St Mary Academy-Bay View.
Ownership History
Date
Name
Owned For
Owner Type
Purchase Details
Closed on
Sep 1, 2017
Sold by
Leandre Richard and Leandre Marie G
Bought by
Leandre Maurice G and Leandre Richard A
Current Estimated Value
Create a Home Valuation Report for This Property
The Home Valuation Report is an in-depth analysis detailing your home's value as well as a comparison with similar homes in the area
Home Values in the Area
Average Home Value in this Area
Purchase History
| Date | Buyer | Sale Price | Title Company |
|---|---|---|---|
| Leandre Maurice G | -- | -- | |
| Leandre Maurice G | -- | -- |
Source: Public Records
Mortgage History
| Date | Status | Borrower | Loan Amount |
|---|---|---|---|
| Previous Owner | Leandre Maurice G | $60,000 | |
| Previous Owner | Leandre Maurice G | $22,500 |
Source: Public Records
Tax History
| Year | Tax Paid | Tax Assessment Tax Assessment Total Assessment is a certain percentage of the fair market value that is determined by local assessors to be the total taxable value of land and additions on the property. | Land | Improvement |
|---|---|---|---|---|
| 2025 | $3,870 | $296,100 | $118,400 | $177,700 |
| 2024 | $3,852 | $251,300 | $98,700 | $152,600 |
| 2023 | $3,709 | $251,300 | $98,700 | $152,600 |
| 2022 | $3,664 | $167,600 | $54,500 | $113,100 |
| 2021 | $3,603 | $167,600 | $53,900 | $113,700 |
| 2020 | $3,451 | $167,600 | $53,900 | $113,700 |
| 2019 | $3,355 | $167,600 | $53,900 | $113,700 |
| 2018 | $3,304 | $144,400 | $52,400 | $92,000 |
| 2017 | $3,230 | $144,400 | $52,400 | $92,000 |
| 2016 | $3,214 | $144,400 | $52,400 | $92,000 |
| 2015 | $3,245 | $141,400 | $48,500 | $92,900 |
| 2014 | $3,245 | $141,400 | $48,500 | $92,900 |
Source: Public Records
Map
Nearby Homes
- 14 Benedict St
- 14 Winthrop St
- 103 Burnside Ave
- 85 Hilton Ave
- 15 Claire St
- 25 Arnold St
- 23 Albert Ave
- 151 Willett Ave Unit 2
- 85 Hospital Rd
- 33 Pine St Unit 35
- 6 Hazelton Rd
- 56 Knowlton St
- 41 White Ave
- 45 Washington Rd
- 0 Carousel Dr
- 43 Bullocks Point Ave Unit 4A
- 25 Bullocks Point Ave Unit 5C
- 33 Bullocks Point Ave Unit 5C
- 6 Fuller Ave
- 7 Jill Ct
Your Personal Tour Guide
Ask me questions while you tour the home.