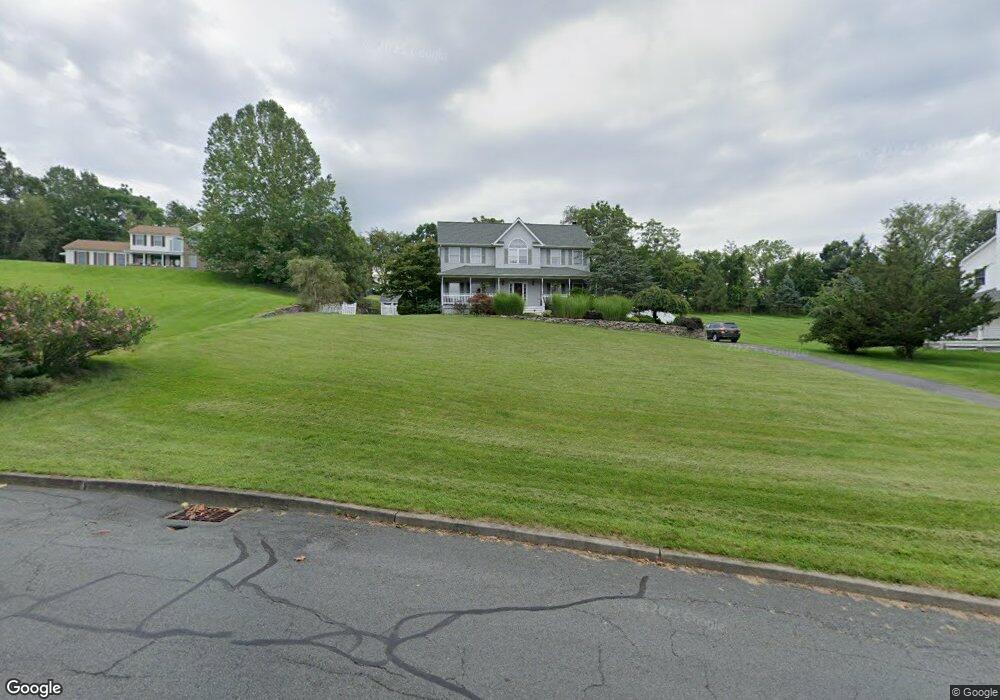
46 Ryan Ct New Windsor, NY 12553
Estimated Value: $734,000 - $859,000
4
Beds
3
Baths
3,495
Sq Ft
$224/Sq Ft
Est. Value
About This Home
This home is located at 46 Ryan Ct, New Windsor, NY 12553 and is currently estimated at $783,750, approximately $224 per square foot. 46 Ryan Ct is a home located in Orange County with nearby schools including Cornwall Middle School, Little Harvard Elementary Schools, and Congregation Mesifta Ohr Hatalmud.
Ownership History
Date
Name
Owned For
Owner Type
Purchase Details
Closed on
Jul 19, 2010
Sold by
Geralis Kimberly
Bought by
Reel David
Current Estimated Value
Purchase Details
Closed on
Mar 27, 2006
Sold by
Grenga Christina M
Bought by
Geralis Kimberly S
Purchase Details
Closed on
Jul 31, 2002
Sold by
Cendant Mobility Financial Corp
Bought by
Grenga Christina M
Home Financials for this Owner
Home Financials are based on the most recent Mortgage that was taken out on this home.
Original Mortgage
$351,900
Interest Rate
5.37%
Purchase Details
Closed on
Jul 13, 2002
Sold by
Rose James B and Rose Kia N
Bought by
Cendant Mobility Financial Corp
Home Financials for this Owner
Home Financials are based on the most recent Mortgage that was taken out on this home.
Original Mortgage
$351,900
Interest Rate
5.37%
Purchase Details
Closed on
Nov 20, 1998
Sold by
Fairview Homes Inc
Bought by
Rose James B and Rose Kia N
Create a Home Valuation Report for This Property
The Home Valuation Report is an in-depth analysis detailing your home's value as well as a comparison with similar homes in the area
Home Values in the Area
Average Home Value in this Area
Purchase History
| Date | Buyer | Sale Price | Title Company |
|---|---|---|---|
| Reel David | $442,500 | Marc Kerchmen | |
| Geralis Kimberly S | $580,000 | Michelle Anderson | |
| Grenga Christina M | $439,900 | -- | |
| Cendant Mobility Financial Corp | $439,900 | -- | |
| Rose James B | $240,000 | -- | |
| Fairview Homes Inc | -- | -- |
Source: Public Records
Mortgage History
| Date | Status | Borrower | Loan Amount |
|---|---|---|---|
| Previous Owner | Grenga Christina M | $351,900 | |
| Previous Owner | Cendant Mobility Financial Corp | $43,900 |
Source: Public Records
Tax History
| Year | Tax Paid | Tax Assessment Tax Assessment Total Assessment is a certain percentage of the fair market value that is determined by local assessors to be the total taxable value of land and additions on the property. | Land | Improvement |
|---|---|---|---|---|
| 2024 | $15,574 | $412,600 | $110,100 | $302,500 |
| 2023 | $15,574 | $412,600 | $110,100 | $302,500 |
| 2022 | $15,502 | $412,600 | $110,100 | $302,500 |
| 2021 | $14,587 | $412,600 | $110,100 | $302,500 |
| 2020 | $14,266 | $412,600 | $110,100 | $302,500 |
| 2019 | $14,014 | $412,600 | $110,100 | $302,500 |
| 2018 | $14,014 | $412,600 | $110,100 | $302,500 |
| 2017 | $13,917 | $412,600 | $110,100 | $302,500 |
| 2016 | $15,155 | $314,750 | $62,000 | $252,750 |
| 2015 | -- | $314,750 | $62,000 | $252,750 |
| 2014 | -- | $314,750 | $62,000 | $252,750 |
Source: Public Records
Map
Nearby Homes
- 3 Clemence Dr
- 325 Jackson Ave
- 4 Jefferson Ave
- 64 Bethlehem Rd
- 70 Bethlehem Rd
- 8 Jefferson Ave
- 16 McDonald Ct
- 1279 State Route 94
- 107 Denniston Dr
- 111 Sycamore Dr
- 2806 Cherry Tree Way
- 213 Orrs Mills Rd
- 8 Oak Dr
- 254 Orrs Mills Rd
- 70 Meadowbrook Ln
- 9 Benedict Ln Unit 5-7
- 50 Waterview Terrace
- 545 Shore Dr
- 64 Palamino Place
- 180 Orrs Mills Rd
Your Personal Tour Guide
Ask me questions while you tour the home.