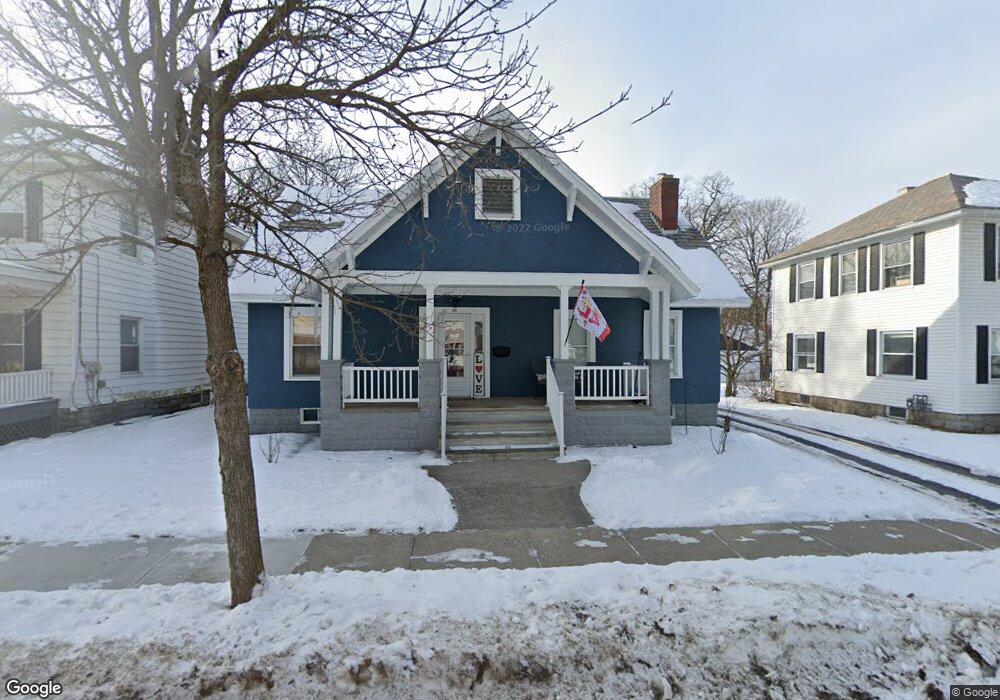
46 Sagamore St Glens Falls, NY 12801
Estimated Value: $268,000 - $317,000
2
Beds
2
Baths
1
Sq Ft
$290,506/Sq Ft
Est. Value
About This Home
This home is located at 46 Sagamore St, Glens Falls, NY 12801 and is currently estimated at $290,506, approximately $290,506 per square foot. 46 Sagamore St is a home located in Warren County with nearby schools including Glens Falls Senior High School and St. Mary-St. Alphonsus Catholic School.
Ownership History
Date
Name
Owned For
Owner Type
Purchase Details
Closed on
Dec 20, 2010
Sold by
North Fna Kelly April Ann
Bought by
Norton John
Current Estimated Value
Home Financials for this Owner
Home Financials are based on the most recent Mortgage that was taken out on this home.
Original Mortgage
$152,305
Outstanding Balance
$90,134
Interest Rate
4.17%
Mortgage Type
Unknown
Estimated Equity
$200,372
Purchase Details
Closed on
Aug 28, 1998
Sold by
Mulcahy Noranne
Bought by
Kelly April
Create a Home Valuation Report for This Property
The Home Valuation Report is an in-depth analysis detailing your home's value as well as a comparison with similar homes in the area
Home Values in the Area
Average Home Value in this Area
Purchase History
| Date | Buyer | Sale Price | Title Company |
|---|---|---|---|
| Norton John | $149,100 | Brandi Burns | |
| Kelly April | $92,597 | -- |
Source: Public Records
Mortgage History
| Date | Status | Borrower | Loan Amount |
|---|---|---|---|
| Open | Norton John | $152,305 |
Source: Public Records
Tax History Compared to Growth
Tax History
| Year | Tax Paid | Tax Assessment Tax Assessment Total Assessment is a certain percentage of the fair market value that is determined by local assessors to be the total taxable value of land and additions on the property. | Land | Improvement |
|---|---|---|---|---|
| 2024 | $5,462 | $216,500 | $37,500 | $179,000 |
| 2023 | $5,341 | $206,200 | $37,500 | $168,700 |
| 2022 | $4,270 | $206,200 | $37,500 | $168,700 |
| 2021 | $3,624 | $105,400 | $17,900 | $87,500 |
| 2020 | $3,922 | $105,400 | $17,900 | $87,500 |
| 2019 | $1,950 | $105,400 | $17,900 | $87,500 |
| 2018 | $1,950 | $105,400 | $17,900 | $87,500 |
| 2017 | $1,926 | $105,400 | $17,900 | $87,500 |
| 2016 | $3,698 | $105,400 | $17,900 | $87,500 |
| 2015 | -- | $105,400 | $17,900 | $87,500 |
| 2014 | -- | $105,400 | $17,900 | $87,500 |
Source: Public Records
Map
Nearby Homes