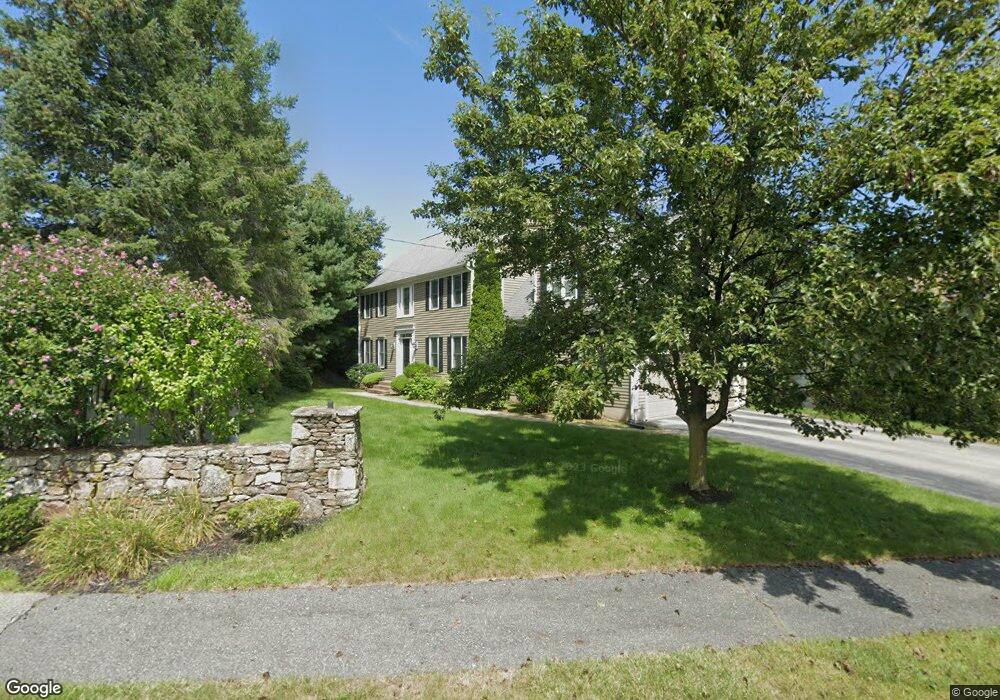
46 Stonybrook Ln Shrewsbury, MA 01545
Estimated Value: $911,000 - $1,171,000
4
Beds
3
Baths
3,000
Sq Ft
$352/Sq Ft
Est. Value
About This Home
This home is located at 46 Stonybrook Ln, Shrewsbury, MA 01545 and is currently estimated at $1,055,838, approximately $351 per square foot. 46 Stonybrook Ln is a home located in Worcester County with nearby schools including Walter J. Paton Elementary School, Sherwood Middle School, and Oak Middle School.
Ownership History
Date
Name
Owned For
Owner Type
Purchase Details
Closed on
Mar 6, 2006
Sold by
Markarian Ann Marie and Wilson Mark R
Bought by
Wilson Ann-Marie and Wilson Mark R
Current Estimated Value
Purchase Details
Closed on
Jun 9, 2005
Sold by
Juetten Christine and Juetten Thomas G
Bought by
Markarian Ann Marie and Wilson Mark R
Home Financials for this Owner
Home Financials are based on the most recent Mortgage that was taken out on this home.
Original Mortgage
$474,675
Interest Rate
5.79%
Mortgage Type
Purchase Money Mortgage
Purchase Details
Closed on
Jun 6, 2003
Sold by
Klahm Mark W and Klahm Rebecca H
Bought by
Juetten Christine and Juetten Thomas
Home Financials for this Owner
Home Financials are based on the most recent Mortgage that was taken out on this home.
Original Mortgage
$396,800
Interest Rate
5.83%
Mortgage Type
Purchase Money Mortgage
Create a Home Valuation Report for This Property
The Home Valuation Report is an in-depth analysis detailing your home's value as well as a comparison with similar homes in the area
Home Values in the Area
Average Home Value in this Area
Purchase History
| Date | Buyer | Sale Price | Title Company |
|---|---|---|---|
| Wilson Ann-Marie | -- | -- | |
| Wilson Ann-Marie | -- | -- | |
| Wilson Ann-Marie | -- | -- | |
| Markarian Ann Marie | $632,900 | -- | |
| Markarian Ann Marie | $632,900 | -- | |
| Markarian Ann Marie | $632,900 | -- | |
| Juetten Christine | $496,000 | -- | |
| Juetten Christine | $496,000 | -- |
Source: Public Records
Mortgage History
| Date | Status | Borrower | Loan Amount |
|---|---|---|---|
| Previous Owner | Markarian Ann Marie | $474,675 | |
| Previous Owner | Juetten Christine | $396,800 |
Source: Public Records
Tax History Compared to Growth
Tax History
| Year | Tax Paid | Tax Assessment Tax Assessment Total Assessment is a certain percentage of the fair market value that is determined by local assessors to be the total taxable value of land and additions on the property. | Land | Improvement |
|---|---|---|---|---|
| 2025 | $111 | $921,600 | $275,600 | $646,000 |
| 2024 | $11,167 | $902,000 | $262,500 | $639,500 |
| 2023 | $10,357 | $789,400 | $262,500 | $526,900 |
| 2022 | $9,709 | $688,100 | $233,300 | $454,800 |
| 2021 | $8,668 | $657,200 | $233,300 | $423,900 |
| 2020 | $8,195 | $657,200 | $233,300 | $423,900 |
| 2019 | $7,836 | $623,400 | $222,100 | $401,300 |
| 2018 | $7,847 | $619,800 | $202,700 | $417,100 |
| 2017 | $7,119 | $554,900 | $183,700 | $371,200 |
| 2016 | $7,160 | $550,800 | $171,700 | $379,100 |
| 2015 | $7,003 | $530,500 | $151,400 | $379,100 |
Source: Public Records
Map
Nearby Homes
- 9 Arnold Rd
- 4 Horseneck Rd
- 18 Eastwood Rd
- 114 Grafton St
- 39 Old Brook Rd
- 60 Harrington Farms Way Unit 60
- 102 Harrington Farms Way
- 33 Shady Lane Ave
- 29 Elma Cir
- 28 Cherry St
- 9 Heritage St
- 21 Fiske St
- 7 Wesleyan St
- 46-50 Wesleyan St
- 25 Harriet Ave
- 19 Grafton St
- 15 Conifer Cir Unit 31
- 5 Conifer Cir Unit 28
- 3 Conifer Cir Unit 29
- 43 Harriet Ave