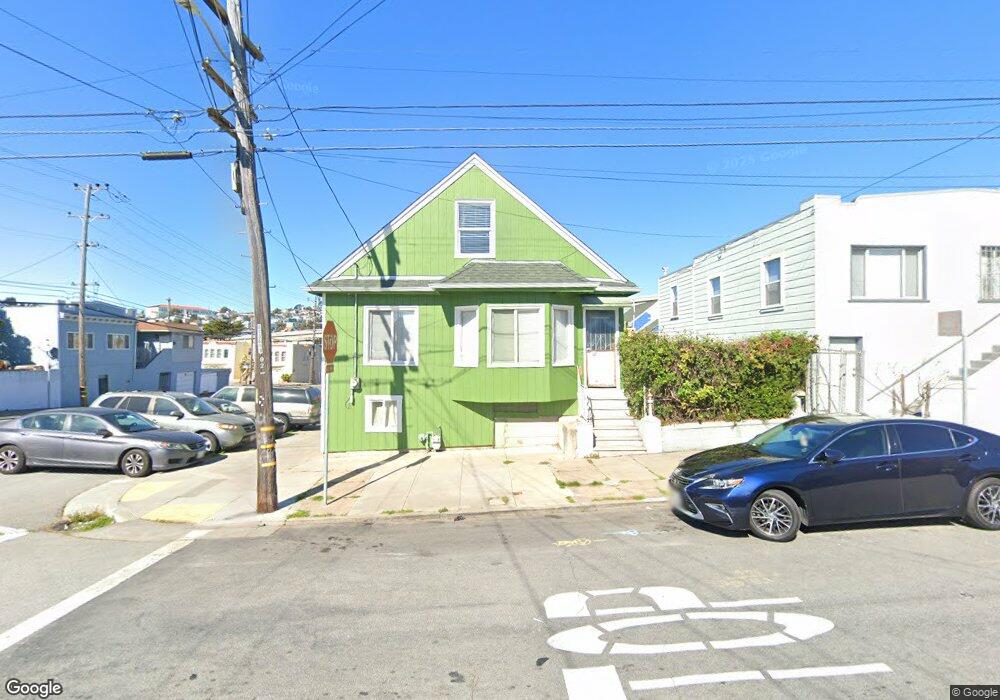
46 Sweeny St San Francisco, CA 94134
Portola NeighborhoodEstimated Value: $1,090,000 - $1,247,787
3
Beds
3
Baths
1,480
Sq Ft
$785/Sq Ft
Est. Value
About This Home
This home is located at 46 Sweeny St, San Francisco, CA 94134 and is currently estimated at $1,161,947, approximately $785 per square foot. 46 Sweeny St is a home located in San Francisco County with nearby schools including Edward R. Taylor Elementary, King Jr. (Martin Luther) Academic Middle School, and San Francisco School.
Ownership History
Date
Name
Owned For
Owner Type
Purchase Details
Closed on
Feb 9, 2025
Sold by
Chen Sunny Qi Xu and Zhang Rui Ling
Bought by
Chen/Zhang Family Trust and Chen
Current Estimated Value
Purchase Details
Closed on
Aug 8, 1996
Sold by
Rojas Carmen
Bought by
Chen Sunny Qi Xu and Zhang Rui Ling
Home Financials for this Owner
Home Financials are based on the most recent Mortgage that was taken out on this home.
Original Mortgage
$62,800
Interest Rate
7.69%
Create a Home Valuation Report for This Property
The Home Valuation Report is an in-depth analysis detailing your home's value as well as a comparison with similar homes in the area
Home Values in the Area
Average Home Value in this Area
Purchase History
| Date | Buyer | Sale Price | Title Company |
|---|---|---|---|
| Chen/Zhang Family Trust | -- | None Listed On Document | |
| Chen Sunny Qi Xu | $173,000 | Fidelity National Title Co |
Source: Public Records
Mortgage History
| Date | Status | Borrower | Loan Amount |
|---|---|---|---|
| Previous Owner | Chen Sunny Qi Xu | $62,800 |
Source: Public Records
Tax History
| Year | Tax Paid | Tax Assessment Tax Assessment Total Assessment is a certain percentage of the fair market value that is determined by local assessors to be the total taxable value of land and additions on the property. | Land | Improvement |
|---|---|---|---|---|
| 2025 | $2,563 | $220,653 | $122,133 | $98,520 |
| 2024 | $2,563 | $216,328 | $119,739 | $96,589 |
| 2023 | $2,526 | $212,088 | $117,392 | $94,696 |
| 2022 | $2,481 | $207,931 | $115,091 | $92,840 |
| 2021 | $2,439 | $203,855 | $112,835 | $91,020 |
| 2020 | $2,445 | $201,766 | $111,679 | $90,087 |
| 2019 | $2,363 | $197,811 | $109,490 | $88,321 |
| 2018 | $2,285 | $193,934 | $107,344 | $86,590 |
| 2017 | $2,258 | $190,133 | $105,240 | $84,893 |
| 2016 | $2,468 | $186,406 | $103,177 | $83,229 |
| 2015 | $2,203 | $183,607 | $101,628 | $81,979 |
| 2014 | $2,370 | $180,012 | $99,638 | $80,374 |
Source: Public Records
Map
Nearby Homes
- 100 Gaven St
- 147 Gaven St
- 900 Bayshore Blvd
- 766 Thornton Ave
- 256 Waterville St
- 326 Hale St
- 345 Felton St
- 600 Silliman St
- 1231 Silver Ave
- 360 Bradford St
- 1000 Crescent Ave
- 446 Nevada St
- 332 Bradford St
- 773 Gates St
- 400 Alemany Blvd Unit 2
- 1029 Silver Ave
- 4007 Folsom St
- 571 Gates St
- 2775 San Bruno Ave
- 864 Moultrie St
Your Personal Tour Guide
Ask me questions while you tour the home.