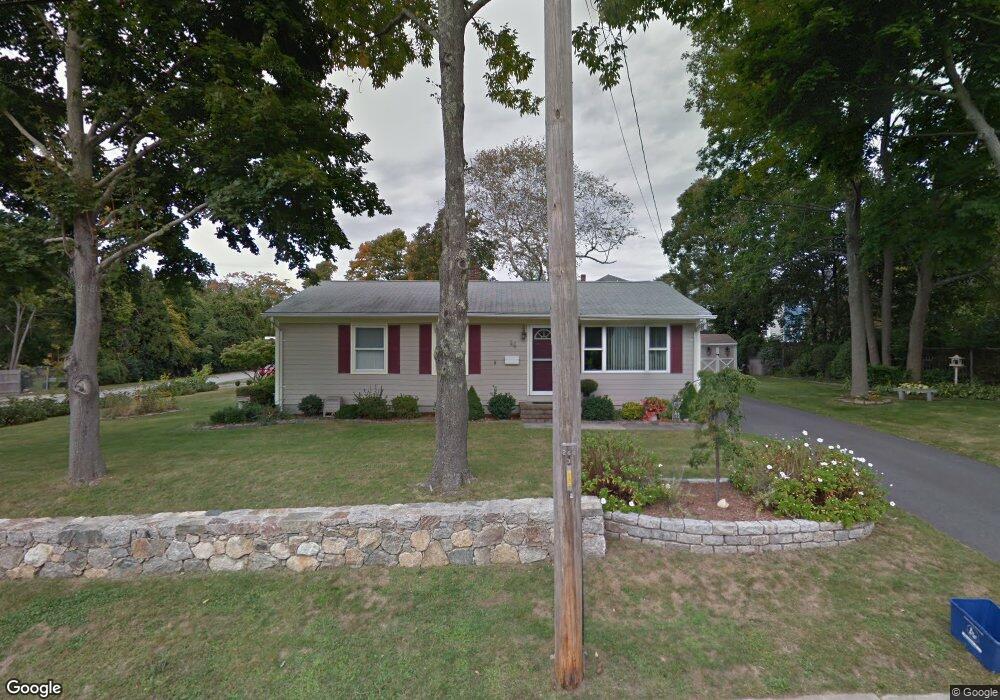
46 Taber St Fairhaven, MA 02719
Oxford NeighborhoodEstimated Value: $426,000 - $489,000
3
Beds
1
Bath
1,008
Sq Ft
$453/Sq Ft
Est. Value
About This Home
This home is located at 46 Taber St, Fairhaven, MA 02719 and is currently estimated at $457,070, approximately $453 per square foot. 46 Taber St is a home located in Bristol County with nearby schools including Fairhaven High School, Alma Del Mar Charter School, and City On A Hill Charter Public School New Bedford.
Ownership History
Date
Name
Owned For
Owner Type
Purchase Details
Closed on
Jun 28, 2011
Sold by
Gaudreau Richard C and Gaudreau Patricia D
Bought by
Gaudreau Patricia D
Current Estimated Value
Purchase Details
Closed on
Nov 9, 1989
Sold by
Gormley Kenneth J
Bought by
Gaudreau Richard C
Home Financials for this Owner
Home Financials are based on the most recent Mortgage that was taken out on this home.
Original Mortgage
$80,000
Interest Rate
10.03%
Mortgage Type
Purchase Money Mortgage
Create a Home Valuation Report for This Property
The Home Valuation Report is an in-depth analysis detailing your home's value as well as a comparison with similar homes in the area
Home Values in the Area
Average Home Value in this Area
Purchase History
| Date | Buyer | Sale Price | Title Company |
|---|---|---|---|
| Gaudreau Patricia D | -- | -- | |
| Gaudreau Richard C | $125,000 | -- |
Source: Public Records
Mortgage History
| Date | Status | Borrower | Loan Amount |
|---|---|---|---|
| Previous Owner | Gaudreau Richard C | $16,000 | |
| Previous Owner | Gaudreau Richard C | $76,000 | |
| Previous Owner | Gaudreau Richard C | $80,000 |
Source: Public Records
Tax History
| Year | Tax Paid | Tax Assessment Tax Assessment Total Assessment is a certain percentage of the fair market value that is determined by local assessors to be the total taxable value of land and additions on the property. | Land | Improvement |
|---|---|---|---|---|
| 2025 | $33 | $356,700 | $176,900 | $179,800 |
| 2024 | $3,087 | $334,500 | $176,900 | $157,600 |
| 2023 | $2,967 | $298,200 | $155,000 | $143,200 |
| 2022 | $2,806 | $274,600 | $144,000 | $130,600 |
| 2021 | $2,684 | $237,700 | $130,300 | $107,400 |
| 2020 | $2,629 | $237,700 | $130,300 | $107,400 |
| 2019 | $2,487 | $213,100 | $108,100 | $105,000 |
| 2018 | $2,374 | $202,000 | $102,800 | $99,200 |
| 2017 | $2,404 | $199,700 | $102,800 | $96,900 |
| 2016 | $2,371 | $194,700 | $102,800 | $91,900 |
| 2015 | $2,343 | $192,800 | $102,800 | $90,000 |
Source: Public Records
Map
Nearby Homes
- 14 Sycamore St
- 313 Main St
- 253 Adams St
- 12 Winsor St
- 71 Sycamore St
- 230 Green St
- 15 School St
- 16 Ash St
- 13 Hawthorne St
- 24 Cotter St
- 34 Washburn St Unit 36
- 39 Christian St
- 57 Washburn St
- 77 Adams St
- 7 Deerfield Ln
- 239 Sawyer St
- 8 Washington St
- 8 Washington St
- 0 Nulands Neck Unit 73286360
- 330 N Front St