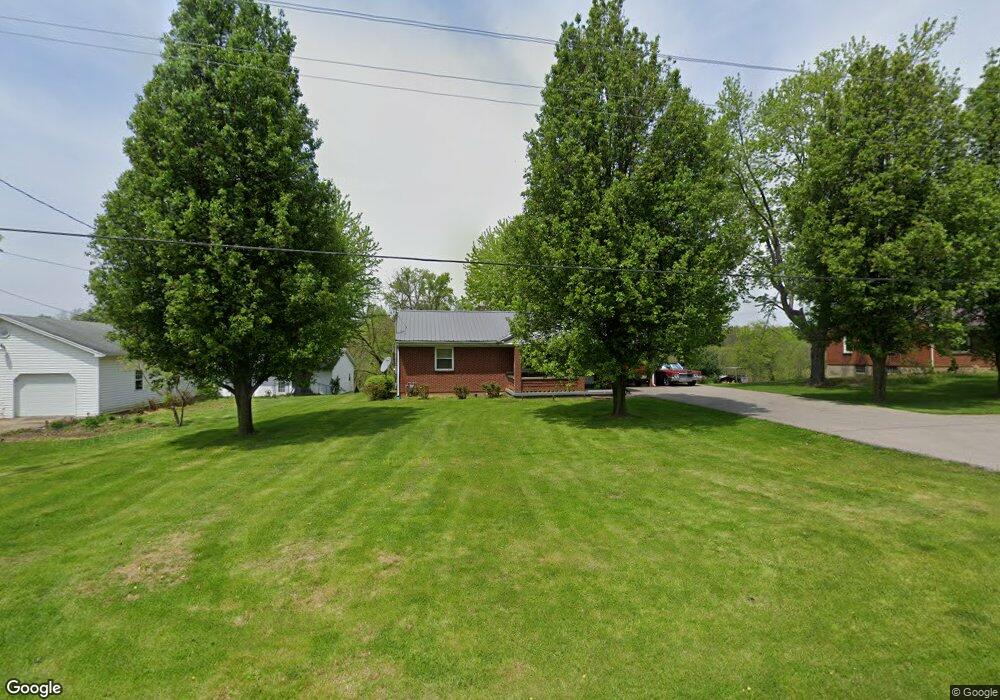
46 Taft Hwy Dry Ridge, KY 41035
Estimated Value: $183,000 - $259,000
2
Beds
1
Bath
988
Sq Ft
$229/Sq Ft
Est. Value
About This Home
This home is located at 46 Taft Hwy, Dry Ridge, KY 41035 and is currently estimated at $225,805, approximately $228 per square foot. 46 Taft Hwy is a home located in Grant County with nearby schools including Dry Ridge Elementary School, Grant County Middle School, and Grant County High School.
Ownership History
Date
Name
Owned For
Owner Type
Purchase Details
Closed on
Jul 30, 2019
Sold by
Rose Jackie G
Bought by
Mcmahan Brittany H
Current Estimated Value
Home Financials for this Owner
Home Financials are based on the most recent Mortgage that was taken out on this home.
Original Mortgage
$132,828
Outstanding Balance
$116,333
Interest Rate
3.7%
Mortgage Type
New Conventional
Estimated Equity
$109,472
Purchase Details
Closed on
Apr 9, 2014
Sold by
Federal National Mortgage Association
Bought by
Rose Jackie G
Purchase Details
Closed on
Feb 5, 2014
Sold by
Perry Herschel W
Bought by
Federal National Mortgage Association
Purchase Details
Closed on
Jul 18, 2008
Sold by
Perry Herschel W and Perry Herschel Wayne
Bought by
Perry Herschel W and Perry Agnes M
Home Financials for this Owner
Home Financials are based on the most recent Mortgage that was taken out on this home.
Original Mortgage
$80,000
Interest Rate
6.37%
Create a Home Valuation Report for This Property
The Home Valuation Report is an in-depth analysis detailing your home's value as well as a comparison with similar homes in the area
Home Values in the Area
Average Home Value in this Area
Purchase History
| Date | Buyer | Sale Price | Title Company |
|---|---|---|---|
| Mcmahan Brittany H | $131,500 | None Available | |
| Rose Jackie G | $85,235 | -- | |
| Federal National Mortgage Association | $71,000 | -- | |
| Perry Herschel W | -- | -- |
Source: Public Records
Mortgage History
| Date | Status | Borrower | Loan Amount |
|---|---|---|---|
| Open | Mcmahan Brittany H | $132,828 | |
| Previous Owner | Perry Herschel W | $80,000 |
Source: Public Records
Tax History Compared to Growth
Tax History
| Year | Tax Paid | Tax Assessment Tax Assessment Total Assessment is a certain percentage of the fair market value that is determined by local assessors to be the total taxable value of land and additions on the property. | Land | Improvement |
|---|---|---|---|---|
| 2024 | $1,521 | $131,500 | $0 | $0 |
| 2023 | $1,390 | $131,500 | $0 | $0 |
| 2022 | $1,413 | $131,500 | $0 | $0 |
| 2021 | $1,408 | $131,500 | $0 | $0 |
| 2020 | $1,408 | $131,500 | $0 | $0 |
| 2019 | $705 | $102,200 | $0 | $0 |
| 2018 | $539 | $85,200 | $0 | $0 |
| 2017 | $537 | $85,200 | $0 | $0 |
| 2014 | $873 | $85,200 | $0 | $0 |
| 2012 | $871 | $90,000 | $30,000 | $60,000 |
Source: Public Records
Map
Nearby Homes
- 28 Taft Hwy
- 25/27 Taft Hwy
- 27 Taft Hwy
- 15 Ridge View Dr
- 28 Broadway St
- 252 Redwood Dr
- 1430 Warsaw Rd Unit 8
- 2095 Warsaw Rd
- 250 Boltz Lake Rd
- 0 Rd Unit 634859
- 122-124 Wood Gate
- 1775 Dry Ridge Mount Zion Rd
- 107-109 Hogan Mill
- 123 Belmont Ct
- 125 Belmont Ct
- 113 Belmont Ct
- 1050 Bannister Pike
- 127 Arlington Ct
- 3910 Taft Hwy
- 114 Arlington Ct