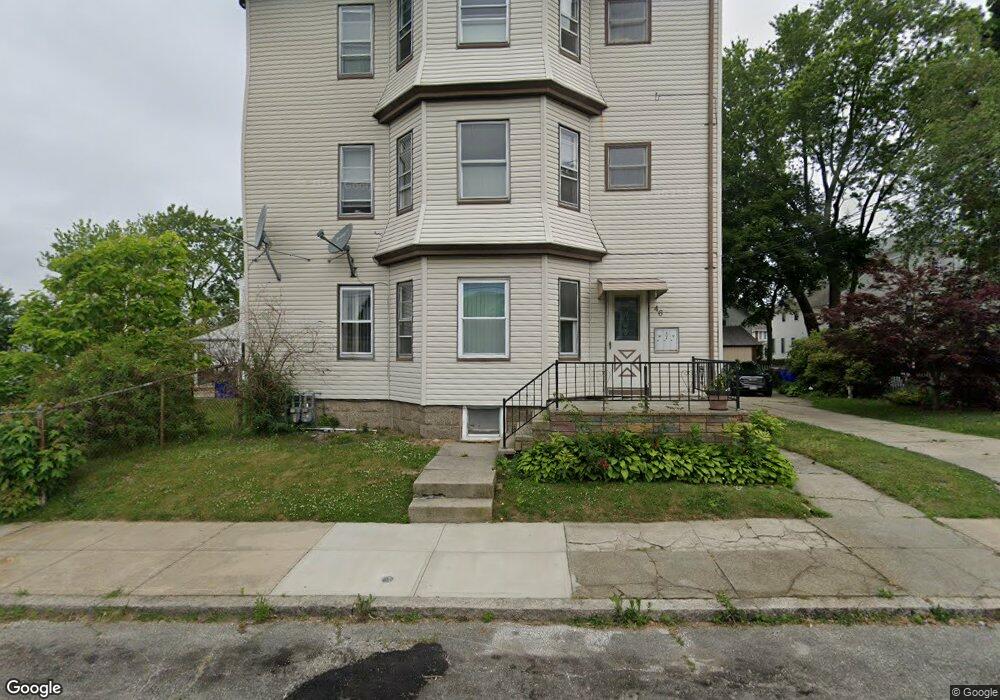
46 Talbot St Fall River, MA 02723
Flint NeighborhoodEstimated Value: $576,000 - $664,000
6
Beds
3
Baths
3,267
Sq Ft
$191/Sq Ft
Est. Value
About This Home
This home is located at 46 Talbot St, Fall River, MA 02723 and is currently estimated at $622,796, approximately $190 per square foot. 46 Talbot St is a home located in Bristol County with nearby schools including Mary Fonseca Elementary School, Talbot Innovation School, and B M C Durfee High School.
Ownership History
Date
Name
Owned For
Owner Type
Purchase Details
Closed on
Sep 1, 1987
Sold by
Pavao Manuel A
Bought by
Charest David P
Current Estimated Value
Home Financials for this Owner
Home Financials are based on the most recent Mortgage that was taken out on this home.
Original Mortgage
$123,500
Interest Rate
10.24%
Mortgage Type
Purchase Money Mortgage
Create a Home Valuation Report for This Property
The Home Valuation Report is an in-depth analysis detailing your home's value as well as a comparison with similar homes in the area
Home Values in the Area
Average Home Value in this Area
Purchase History
| Date | Buyer | Sale Price | Title Company |
|---|---|---|---|
| Charest David P | $130,000 | -- |
Source: Public Records
Mortgage History
| Date | Status | Borrower | Loan Amount |
|---|---|---|---|
| Open | Charest David P | $147,695 | |
| Closed | Charest David P | $105,622 | |
| Closed | Charest David P | $123,500 |
Source: Public Records
Tax History
| Year | Tax Paid | Tax Assessment Tax Assessment Total Assessment is a certain percentage of the fair market value that is determined by local assessors to be the total taxable value of land and additions on the property. | Land | Improvement |
|---|---|---|---|---|
| 2025 | $5,978 | $522,100 | $108,200 | $413,900 |
| 2024 | $5,723 | $498,100 | $104,200 | $393,900 |
| 2023 | $5,029 | $409,900 | $86,100 | $323,800 |
| 2022 | $4,475 | $354,600 | $82,000 | $272,600 |
| 2021 | $4,226 | $305,600 | $78,000 | $227,600 |
| 2020 | $3,803 | $263,200 | $76,900 | $186,300 |
| 2019 | $3,250 | $222,900 | $74,000 | $148,900 |
| 2018 | $3,133 | $214,300 | $80,200 | $134,100 |
| 2017 | $2,947 | $210,500 | $76,400 | $134,100 |
| 2016 | $2,891 | $212,100 | $81,300 | $130,800 |
| 2015 | $2,774 | $212,100 | $81,300 | $130,800 |
| 2014 | $2,790 | $221,800 | $78,900 | $142,900 |
Source: Public Records
Map
Nearby Homes
- 150 Downing St
- 165 Eastern Ave
- 580 County St
- 70 Jencks St
- 88 Harrison St Unit 5
- 178 Thomas St
- 10 Carlisa Dr
- 1244 Pleasant St
- 129 County St
- 756 County St
- 1155-1157 Pleasant St
- 529 Eastern Ave
- 243 Oak Grove Ave
- 84 Healy St
- 139 Quarry St
- 31 Choate St
- 869 Bedford St
- 152 Alden St
- 25 Lebanon St Unit D
- 25 Lebanon St Unit C
Your Personal Tour Guide
Ask me questions while you tour the home.