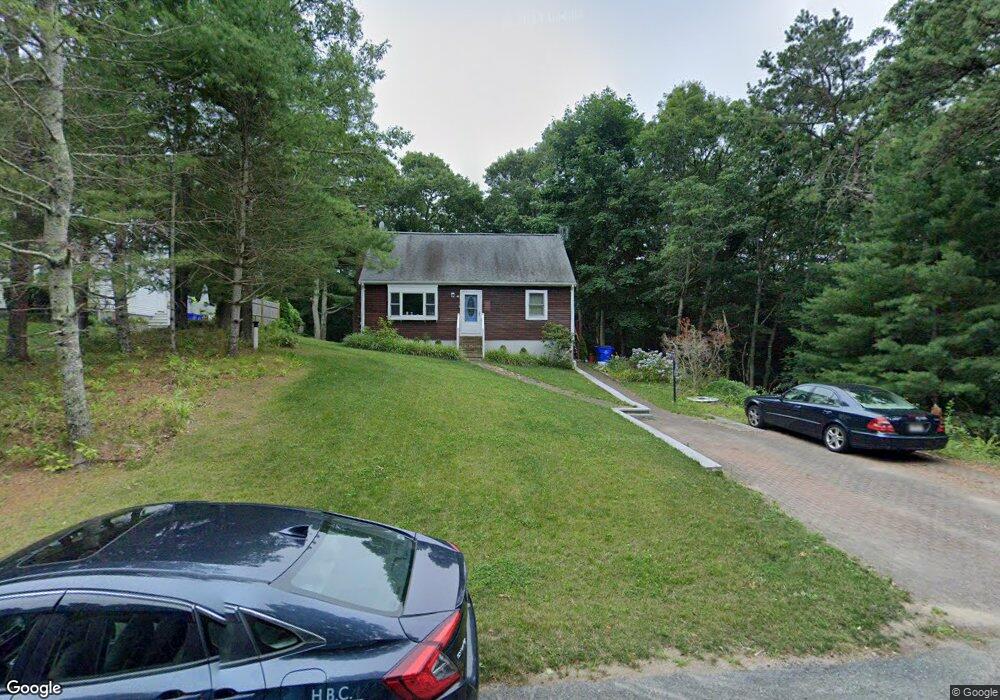
46 Thom Ave Bourne, MA 2532
Monument Beach NeighborhoodEstimated Value: $559,533 - $592,000
4
Beds
2
Baths
1,428
Sq Ft
$398/Sq Ft
Est. Value
About This Home
This home is located at 46 Thom Ave, Bourne, MA 2532 and is currently estimated at $568,883, approximately $398 per square foot. 46 Thom Ave is a home located in Barnstable County with nearby schools including Bourne High School, Cadence Academy Preschool - Bourne, and St Margaret Regional School.
Ownership History
Date
Name
Owned For
Owner Type
Purchase Details
Closed on
Aug 25, 2023
Sold by
Burt Lt and Burt
Bought by
Mulvey Carolyn M
Current Estimated Value
Home Financials for this Owner
Home Financials are based on the most recent Mortgage that was taken out on this home.
Original Mortgage
$479,250
Outstanding Balance
$468,173
Interest Rate
6.96%
Mortgage Type
Purchase Money Mortgage
Estimated Equity
$100,710
Purchase Details
Closed on
Oct 25, 2018
Sold by
Burt Robert G and Burt Marsha A
Bought by
Burt Lt and Burt
Create a Home Valuation Report for This Property
The Home Valuation Report is an in-depth analysis detailing your home's value as well as a comparison with similar homes in the area
Home Values in the Area
Average Home Value in this Area
Purchase History
| Date | Buyer | Sale Price | Title Company |
|---|---|---|---|
| Mulvey Carolyn M | $532,500 | None Available | |
| Mulvey Carolyn M | $532,500 | None Available | |
| Burt Lt | -- | -- | |
| Burt Lt | -- | -- |
Source: Public Records
Mortgage History
| Date | Status | Borrower | Loan Amount |
|---|---|---|---|
| Open | Mulvey Carolyn M | $479,250 | |
| Closed | Mulvey Carolyn M | $479,250 |
Source: Public Records
Tax History Compared to Growth
Tax History
| Year | Tax Paid | Tax Assessment Tax Assessment Total Assessment is a certain percentage of the fair market value that is determined by local assessors to be the total taxable value of land and additions on the property. | Land | Improvement |
|---|---|---|---|---|
| 2025 | $3,467 | $443,900 | $190,200 | $253,700 |
| 2024 | $3,390 | $422,700 | $181,100 | $241,600 |
| 2023 | $3,296 | $374,100 | $160,300 | $213,800 |
| 2022 | $3,143 | $311,500 | $141,800 | $169,700 |
| 2021 | $3,054 | $283,600 | $129,100 | $154,500 |
| 2020 | $2,879 | $268,100 | $127,800 | $140,300 |
| 2019 | $2,735 | $260,200 | $127,800 | $132,400 |
| 2018 | $2,569 | $243,700 | $116,000 | $127,700 |
| 2017 | $2,354 | $228,500 | $114,900 | $113,600 |
| 2016 | $2,298 | $226,200 | $114,900 | $111,300 |
| 2015 | $2,278 | $226,200 | $114,900 | $111,300 |
Source: Public Records
Map
Nearby Homes